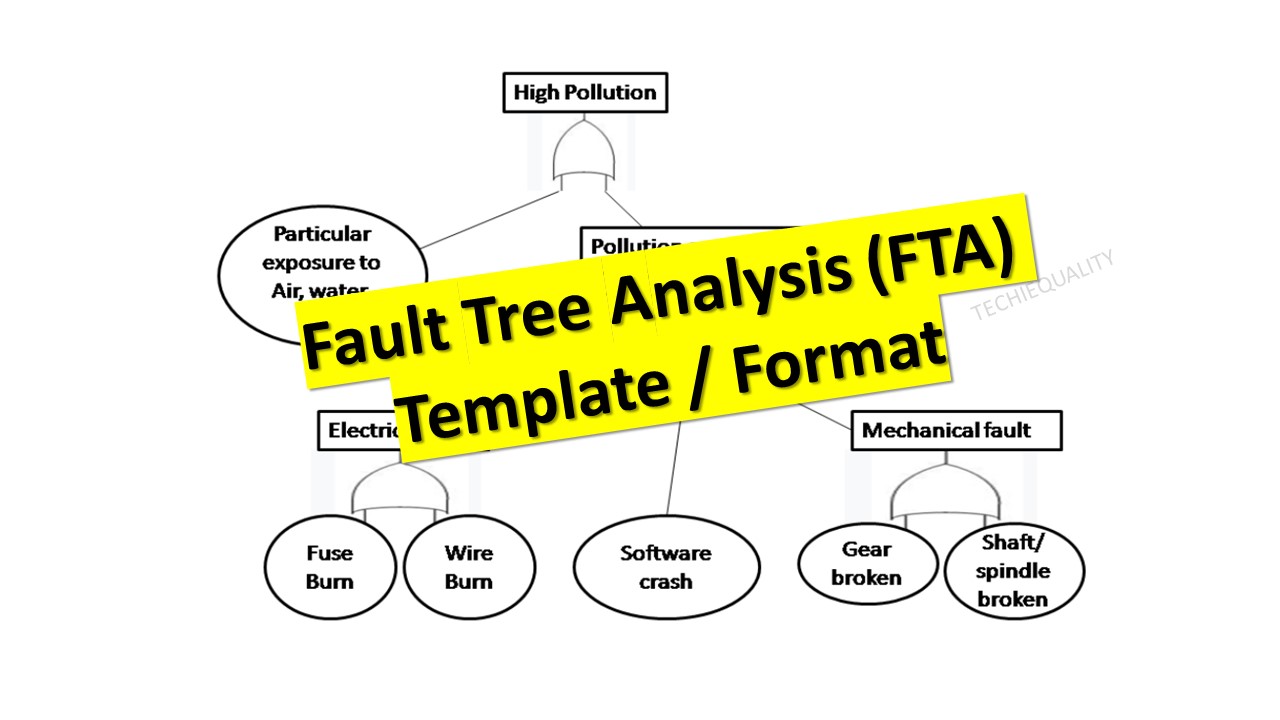
Fault tree analysis template | Download format | FTA with Example:
Hi Readers! Today we will discuss on FTA. And also we have prepared some templates/formats considering with some situations. You can download the same templates from the below links. FTA (Fault tree analysis template) was developed by H.A Watson at Bell Laboratory in 1962. Fault tree analysis is generally used to analyze the undesired state of a system through Boolean algebra. This is commonly applicable in the fields of the Nuclear power sector, Chemical manufacturing and service sector, Pharmaceutical, Petrochemical, Aerospace, and other high-hazard industries but now it has become a popular diagram that is being used in almost all types of organizations or sectors.
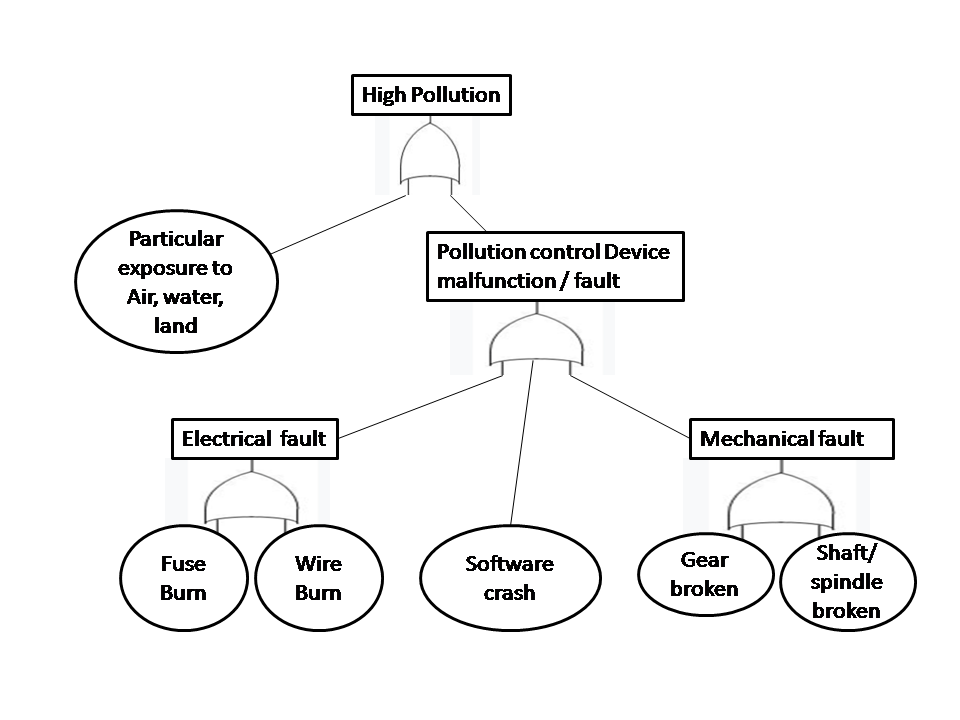
As we know, if any incidents occur (may be due to high-risk factors or particular system level failure) in a high-hazard factory may lead to a high Severity score in health, environment, and safety concerns. So here we will explain the FTA in detail with EHS-related Examples.
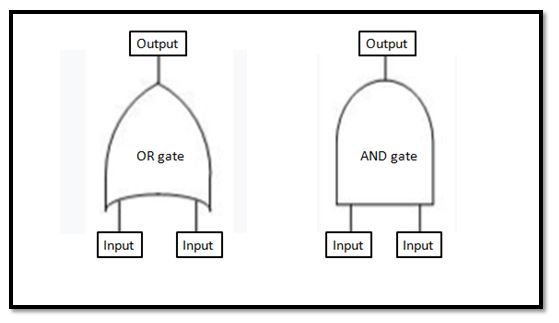
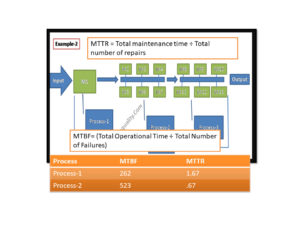
The output occurs if any input occurs. In the above figure you can see there is I/P-1 and I/P-2 in Or-Gate, The output of OR-gate will occur when any one of among two inputs will occurs. But in the case of AND-gate, the output will occur when both the input (I/P-1 & I/P-2) will occur.
Shanti Gopal Pradhan is an experienced professional in Quality Management Systems, QA, Operations, Business Excellence, and Process Improvement. He has strong expertise in international standards including IATF 16949, ISO 9001, ISO 14001, ISO 45001, and ISO 17025, along with methodologies such as TQM, TPM, and Six Sigma.
He holds a degree in Mechanical Engineering along with an MBA, combining strong technical acumen with strategic business insight, he is a Certified Internal Auditor, Lead Auditor, and Six Sigma Black Belt, with a proven track record in driving quality transformation and operational excellence.
Hello readers! Today we will discuss on How to enhance production in manufacturing unit. So you know that enhancing the production quantity with the same capacity is a big challenge in the manufacturing industry. Changing the mindset of manpower (operators, unions, staff, etc.) is another challenge. So here we will discuss on same points to overcome such type of issue and will give you some solutions that you need to follow some below steps for enhancing the production quantity. Many organizations are giving more focus on cost reduction in several ways. As you know that if organisations will succeed in the below parameters then definitely they shall enhance the turnover.
To Reduce
the COPQ.
Eliminate
the wastage.
Comprehensive
PPC.
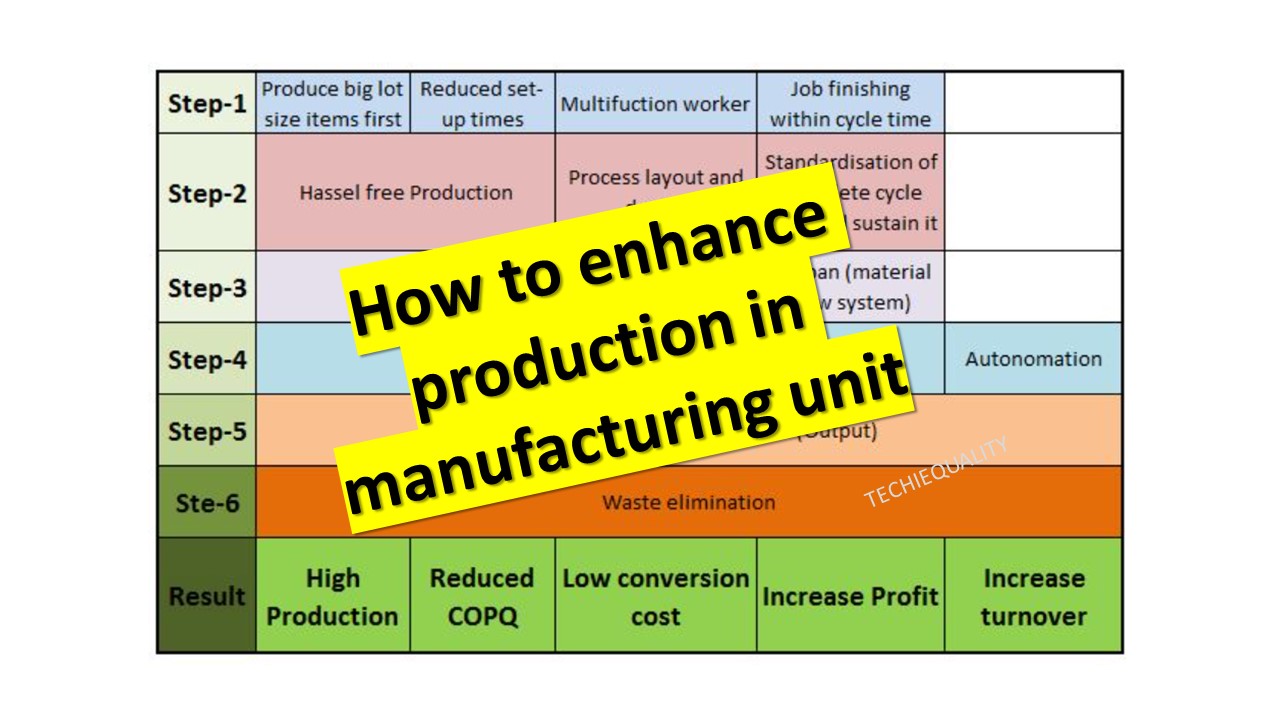
In a wide range, there are so many parameters that we need to give more focus to improve them step by step. Some are mentioned in below figure;
Figure-1
Before we discuss step by step, kindly have a quick look at the above figure first. Many organizations skip the little things or do not consider them during production planning due to some unavoidable circumstance. But later on, they face many problems at the in-process, customer end, and business planning levels.
Details on How to enhance production in manufacturing unit:
Frequently changing of production tooling may take more set-up time which can reduce the quantity needed to be produced. Consider big lot-size items first and reduce the tool set-up time by introducing SMDC methodology, and automatic tooling handling, by reducing the tool repairing time, by enhancing the skill level of personnel, by introducing the tooling management system. etc.
The multifunction worker can reduce the job finishing cycle time by doing multiple jobs at a time in a standardized machine layout. Many automobile manufacturing industries have installed the machine in a ‘U-layout’ at the assembly process. This layout is the most popular one in the automobile manufacturing industry which can reduce the operation cycle time and manpower as well.
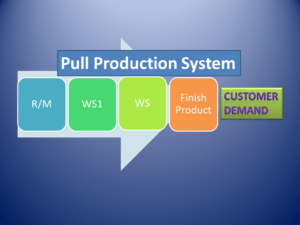
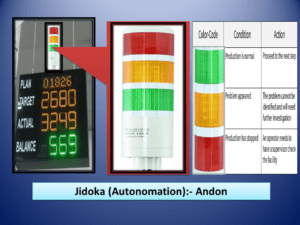
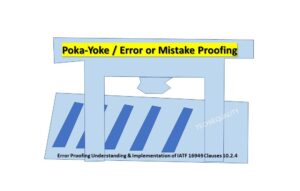
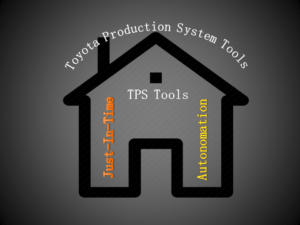
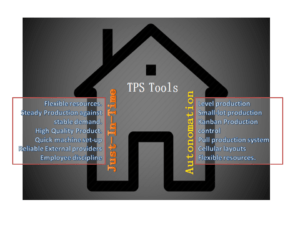
After completion of the above job, now it’s time to think about the smooth movement of incoming material to the operation process, quality control at place and just-in time. For doing so KANBAN methodology is the older one but is more effective and helpful for the smooth movement of material for pre and post-operation. And for quality control, many organization transferred their traditional manual process to Autonomation. In this platform, organizations are installing the Andon system, Poka-yoke (Error proofing), Yo-i-don (Ready, set, go). Same you can introduce in your manufacturing process.
For just-in-time, an organization has to work hard at their supplier end as well as their own process. Just-in-time’s primary focus is zero inventories. If you will succeed in implementing the Jus-in-time concept at your and the vendor’s end then the organization can reduce the wastage. There are so many initiatives available to eliminate wastage like Lean manufacturing, lean design, Lean six-sigma, Quality circle concept, and kaizen, TPM (OEE improvement and loss reduction), etc.
Shanti Gopal Pradhan is an experienced professional in Quality Management Systems, QA, Operations, Business Excellence, and Process Improvement. He has strong expertise in international standards including IATF 16949, ISO 9001, ISO 14001, ISO 45001, and ISO 17025, along with methodologies such as TQM, TPM, and Six Sigma.
He holds a degree in Mechanical Engineering along with an MBA, combining strong technical acumen with strategic business insight, he is a Certified Internal Auditor, Lead Auditor, and Six Sigma Black Belt, with a proven track record in driving quality transformation and operational excellence.
SPC Format | DOWNLOAD Excel Template of SPC Study:
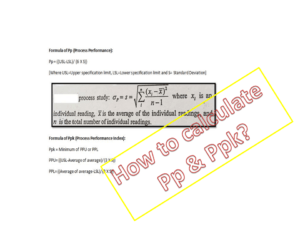
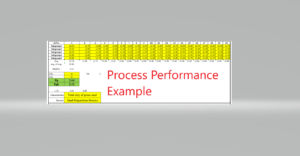
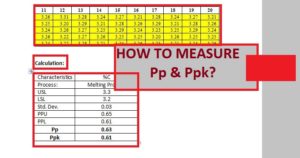
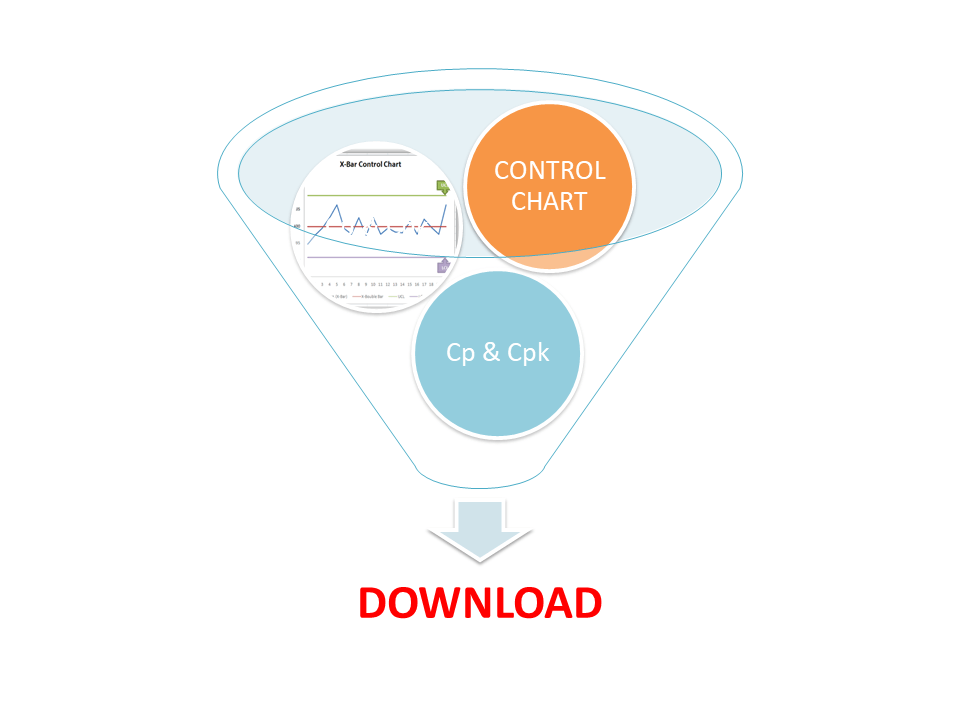
SPC Format is commonly used in the industry to know Process capability and how well the process Performs to meet the requirements. The SPC study consists of [1] Control Chart and [2] Process Capability. Here we will not discuss the statistical process control because we have already so many posts on our website “Techiequality.Com”. Links are mentioned at the bottom of this article. We have prepared simple Excel templates/ formats to keep in mind with the latest version of the SPC manual. And also we are offering here to our valuable readers to download the SPC format in Excel. These SPC charts, formats, and templates are given below, you are supposed to just click on the link to download the Excel file.
The Techiequality.Com has been helping its readers with all extensions to enhance their skills with best industrial practices w.r.t QA, QC, Six Sigma concept, Lean design, lean manufacturing, business excellence, 5’S, etc. So mentioned some posts below that you would love to read…
Shanti Gopal Pradhan is an experienced professional in Quality Management Systems, QA, Operations, Business Excellence, and Process Improvement. He has strong expertise in international standards including IATF 16949, ISO 9001, ISO 14001, ISO 45001, and ISO 17025, along with methodologies such as TQM, TPM, and Six Sigma.
He holds a degree in Mechanical Engineering along with an MBA, combining strong technical acumen with strategic business insight, he is a Certified Internal Auditor, Lead Auditor, and Six Sigma Black Belt, with a proven track record in driving quality transformation and operational excellence.
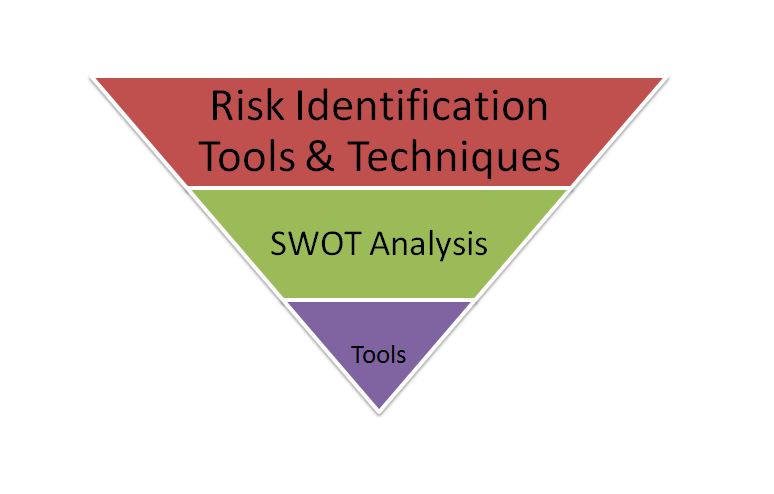
Hello Readers! Today we will discuss Risk identification tools and techniques & identification of several types of risks. As you know most of the business system standards are upgraded to risk base. And there is a special clause mentioned in the new standard as risk and opportunity. So here we will talk about tools and techniques to identify the risk related to the standard requirements. Before going through the details process download the risk identification template/formats from the below links.
DOWNLOAD-SWOT Analysis Format for risk identification.
Although we have posted separate articles on SWOT analysis
and Risk identification Tools, even also we will let you know about the steps
and basic idea of risk identification. Every standard has some input while
identification of Risk and Opportunity. A simple example is prescribed below
for your better understanding.
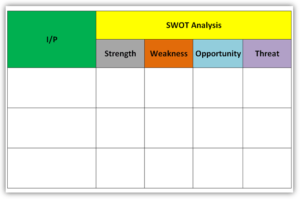
SWOT Analysis Technique:
SWOT stands for Strengths, weaknesses, opportunities, and threats. Before doing analysis you have to identify the past and current issues.
Steps:
Identify the
past and current issues.
Consider the Business standard’s input to identify the probability of uncertainty.
Example: let you are going to identify the risk and opportunity related to marketing/sales operations and use the SWOT analysis to do so.
Past and current issue: Field failure.
Probability of uncertainty: Low sales volume.
Strengths
Weaknesses
Opportunities
Threats
Field failure
Advanced research and development centre, On-job training and knowledge enhancement to the inspector, advanced service centre.
1. Manufacturing defect, 2. Design problem.
1. Provision for error proofing to prevent the manufacturing process defect. 2. Provision in further analysis of design-related problems.
Profit loss, customer dissatisfaction.
Low sales volume
….
Competitive market, inconsistent market demand,
We can start selling products in overseas, if possible some offer on the product.
Profit loss, low sales turnover.
If you would like to know more about SWOT Analysis in several operations and other tools to identify the risks and opportunities then read the below post;
We have discussed here only on SWOT Analysis methodology to identify the Risk but there are many more methods, tools, and ways to identify the Risk.
If you would like to identify the OH&S-related risk then you can use the HIRA Study and HAZOP study also.
similarly, for EMS-related Risk, you can do an Aspect and impact study.
For process and design-related risk identification, you can do the PFMEA and DFMEA study.
Shanti Gopal Pradhan is an experienced professional in Quality Management Systems, QA, Operations, Business Excellence, and Process Improvement. He has strong expertise in international standards including IATF 16949, ISO 9001, ISO 14001, ISO 45001, and ISO 17025, along with methodologies such as TQM, TPM, and Six Sigma.
He holds a degree in Mechanical Engineering along with an MBA, combining strong technical acumen with strategic business insight, he is a Certified Internal Auditor, Lead Auditor, and Six Sigma Black Belt, with a proven track record in driving quality transformation and operational excellence.
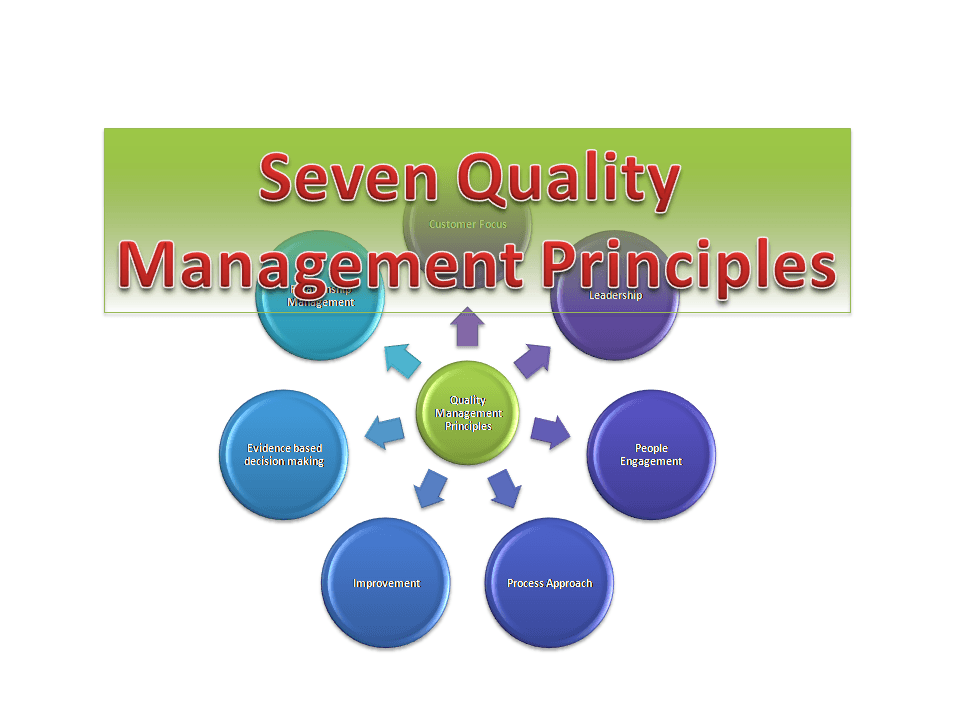
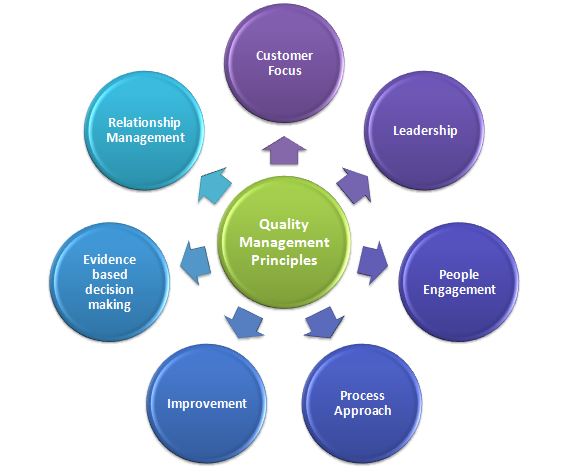
Hello Readers! Today we will discuss here in principles of a quality management system. There are 7 principles of QMS on which ISO 9001 and IATF 16949 are based. Seven quality management principles are [1] Customer Focus [2] Leadership [3] Engagement of people [4] Process Approach [5] Improvement [6] Evidence-based decision-making [7] Relationship Management.
Customer Focus: The primary focus of QMS is to meet customer requirements (Needs and Expectations).
Leadership: Leaders at all levels (process owners) will establish unity and provide the direction to meet the QMS requirements and quality targets.
People Engagement: Participation and consultation of people in concern function to deliver the value.
Process Approach: Enables an organization to plan its processes and their interaction. An organization shall focus on risk-based thinking and ensure the adequacy of resources, process control, monitoring, and measurement.
Improvement: The organization is supposed to focus on improvement (continual/continuous).
Evidence-based decision making: Decision-based on the analysis and evaluation of data.
Relationship Management: The organization manages its relationship with the employee, union, interested parties, customer, external provider, etc.
Shanti Gopal Pradhan is an experienced professional in Quality Management Systems, QA, Operations, Business Excellence, and Process Improvement. He has strong expertise in international standards including IATF 16949, ISO 9001, ISO 14001, ISO 45001, and ISO 17025, along with methodologies such as TQM, TPM, and Six Sigma.
He holds a degree in Mechanical Engineering along with an MBA, combining strong technical acumen with strategic business insight, he is a Certified Internal Auditor, Lead Auditor, and Six Sigma Black Belt, with a proven track record in driving quality transformation and operational excellence.
Hello readers! Today we will discuss the process approach. Why QMS standard (ISO 9001, IATF 16949) promotes the adoption of a process approach when developing, implementing, and improving the effectiveness of a quality management system, to enhance customer satisfaction by meeting customer requirements. As per ISO definition process approach is; Understanding and managing interrelated processes as a system contributes to the organization’s effectiveness and efficiency in achieving its intended results. This approach enables the organization to control the interrelationships and interdependencies among the processes of the system so that the overall performance of the organization can be enhanced.
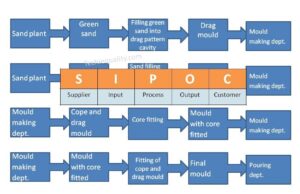
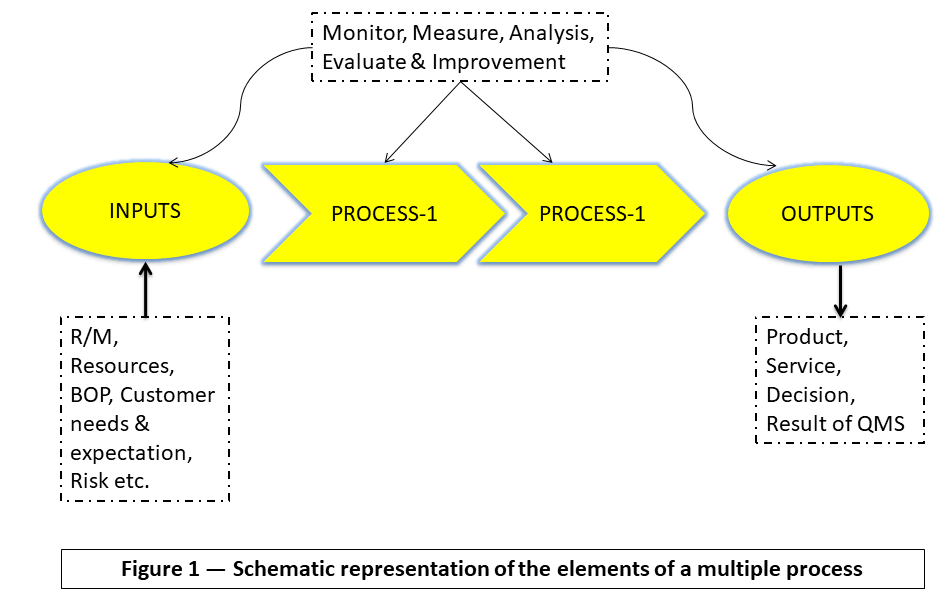
As we know organizations have several departments for executing a certain activity. And for multiple processes, it’s difficult to understand the process interaction and department involvement. So the process approach will help you to meet the intended result of QMS and Customer requirements. Every process follows the PDCA cycle to complete the activities as plan-do-check-act. For completing the cycle of PDCA, the individual department will be involved in the appropriate phase. The Schematic diagram of multiple processes is given below.
The process approach is one of the Principles of QMS.
How a company correlates its activity after getting orders from customers:
Basically, the customer intimates the order to the customer representative (marketing) and then the organization executes the job activities according to their process approach. Subsequent to the customer requirement, the PPC department prepares the monthly/shift-wise plan and accordingly informs to support department for readiness and prompt supply of input requirements. Then the process manager arranges the process accordingly to execute the process and simultaneously QC team monitors the process and product characteristics to confirm the product and allow passing the next operation and doing so the product is made and supplied to the customer with the fulfillment of their requirement. I hope you got a complete idea of how the process and several departments have interacted with each other to complete the jobs. So actually this is called the process approach.
Shanti Gopal Pradhan is an experienced professional in Quality Management Systems, QA, Operations, Business Excellence, and Process Improvement. He has strong expertise in international standards including IATF 16949, ISO 9001, ISO 14001, ISO 45001, and ISO 17025, along with methodologies such as TQM, TPM, and Six Sigma.
He holds a degree in Mechanical Engineering along with an MBA, combining strong technical acumen with strategic business insight, he is a Certified Internal Auditor, Lead Auditor, and Six Sigma Black Belt, with a proven track record in driving quality transformation and operational excellence.
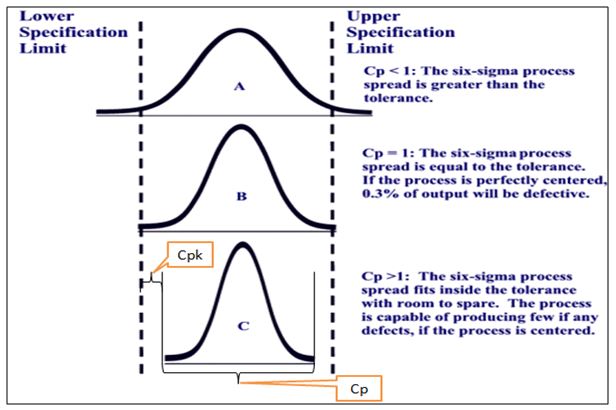
Hello Readers! Today we will discuss here on Interpretation of Process capability Analysis’s Result. As you know Process Capability (Cp) is a statistical measurement of a process’s ability to produce parts within specified limits on a consistent basis and it gives us the idea about the width of the Bell curve. And similarly, the Process capability index (Cpk) gives the idea as [1] how closely a process is able to produce the output to its overall specifications. [2] More Value of Cpk means more process capable. [3] Cpk value <1 means the bell curve will out of USL/LSL. This article is all about the decision of process capability analysis means how to take a decision after measuring /calculating the Cp & Cpk value. For your better understanding, we have mentioned the other topics, first of all, go through these articles and download the Excel template /format as well.
As you can see in the above figure, we have considered the three conditions as Cp=1, Cp>1, and Cp<1. The value Cp is generally gives an idea about the width of the bell curve. It means sample spread width. We will see in the graph whether the width of the bell curve is within the specification limit or not. And also we shall give attention to Cpk and Cp value. The complete decision of the above figure is given and if simultaneously, you would like to read our similar types of posts then, you can read the given below articles/topics/posts.
If the width of Bell Curve is within the specification limit means, sample parameters are within the specification. Less symmetric width w.r.t mean value indicate more control in process.
If width of the curve is out of specification limit [see the above figure, condition Cp<1] it indicate that some of the sample parameters are out of specification (USL/LSL).
Best Industry Practices and as per CSR, the start-up value of Cpk is 1.33 and More Value of Cpk means more process capable.
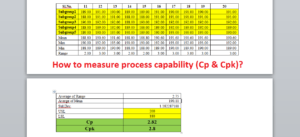
How to start calculating Cp and Cpk value of manufacturing process parameters?
If the manufacturing process is stable or controlled, then start recording the variable type data after selecting the subgroup type.
Calculate the standard deviation value.
and finally, apply the formula of Cp and Cpk to calculate the value.
Note: We have already mentioned the Articles in this post for manual calculation and by using Minitab. Just read these articles.
Shanti Gopal Pradhan is an experienced professional in Quality Management Systems, QA, Operations, Business Excellence, and Process Improvement. He has strong expertise in international standards including IATF 16949, ISO 9001, ISO 14001, ISO 45001, and ISO 17025, along with methodologies such as TQM, TPM, and Six Sigma.
He holds a degree in Mechanical Engineering along with an MBA, combining strong technical acumen with strategic business insight, he is a Certified Internal Auditor, Lead Auditor, and Six Sigma Black Belt, with a proven track record in driving quality transformation and operational excellence.
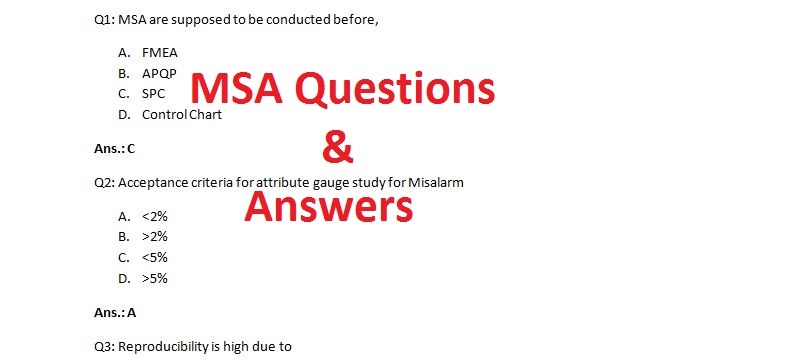
Hello Readers! Today we will discuss on some popular Interview questions of MSA (Measurement System Analysis). MSA is one of the popular techniques/Methods/Tools among the five core AIAG tools. Basically, the company follows the MSA to know the condition of the gauge /instrument and to know the effectiveness of the appraiser. MSA (Measurement system analysis) is classified into two types i.e. [1] Gauge R & R and [2] Attribute type MSA. If you would like to learn more about Repeatability vs. reproducibility and also you could download the Free Template from the below links. MSA interview questions and answers are given below.
DOWNLOAD the QC / QA / 7QC Tools Excel Template. Learn more about the below topic as;
Q2: Acceptance criteria for attribute gauge study for
Misalarm
<2%
>2%
<5%
>5%
Ans.: A
Q3: Reproducibility is high due to
Equipment variation
Wrong instrument used
Variation due to appraiser
None of the above
Ans.: C
Q4: Gauge R&R study acceptance criteria
R&R<10%
ndc < 5
Both option A&B
R&R>30
Ans.: A
Q5: Elements of a measurement system
Instrument
Inspector, instrument, part, characteristics
etc.
Inspector, instrument, checking method,
environment etc.
None of the above
Ans.: C
Q6: Appropriate statistical study to capture precision
Bias
GR&R
Linearity
None of the above
Ans.: A
Q7: Repeatability represents variation due to
Instrument
Equipment
Appraiser
None of the above
Ans.: A and B.
The above questions are commonly asked in interviews (may be in written or PI). To know more about MSA, read the MSA AIAG Latest manual. You can also read our other useful posts from the below link
Shanti Gopal Pradhan is an experienced professional in Quality Management Systems, QA, Operations, Business Excellence, and Process Improvement. He has strong expertise in international standards including IATF 16949, ISO 9001, ISO 14001, ISO 45001, and ISO 17025, along with methodologies such as TQM, TPM, and Six Sigma.
He holds a degree in Mechanical Engineering along with an MBA, combining strong technical acumen with strategic business insight, he is a Certified Internal Auditor, Lead Auditor, and Six Sigma Black Belt, with a proven track record in driving quality transformation and operational excellence.
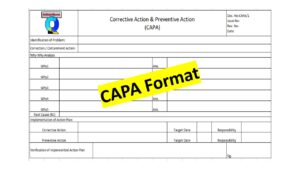
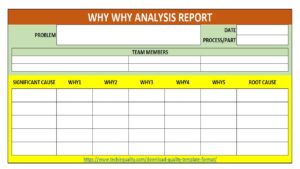
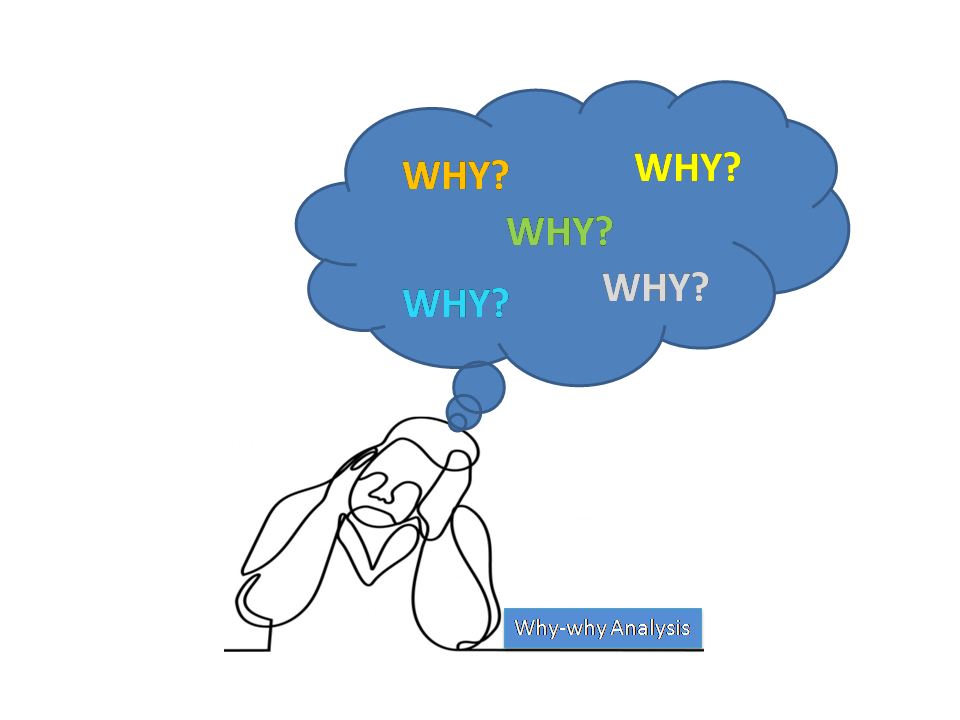
Hello readers! Today we will discuss “why why analysis methodology”. How effectively you can do the 5-why analysis. This analysis is the common tool used in the industry to find out the root cause of the problem but most of the people make mistakes during why-why analysis. So we will talk about the step-by-step methodology of why-why analysis. The why-why analysis is one of the inputs for executing the 8D report, CAPA (Corrective action and preventive action), and RCA (Root Cause analysis). Click on the below-given link to download the 8D and CAPA format.
Understanding the
why-why analysis methodology by example:
Let Part number 123 find ingate shrinkage after the shot-blasting operation. So this case process-QA engineer started the why-why analysis by using the above methodology.
Identify the Problem:
At the shot-blasting operation, a process-QA engineer identified that two number casting got rejected due to ingate shrinkage.
Understand the
Problem:
Understanding the problem means technically knowing what exactly is it? How is it occurring? (potential cause). In the above example, we are supposed to have knowledge on “what is shrinkage?
CFT team formation:
If you think that the problem may be due to issues with the melting parameter, moulding parameter, or design. Then you have to create a CFT team considering with the above departments.
Identify the
Potential cause:
Now initially individual members will identify the potential cause. And then combine all members of the CFT team will identify the potential cause. Let’s see, in case of a shrinkage problem what would be the final list of potential cause.
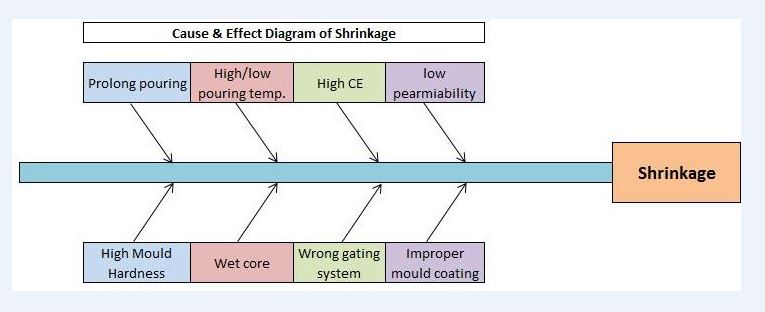
Why-why analysis:
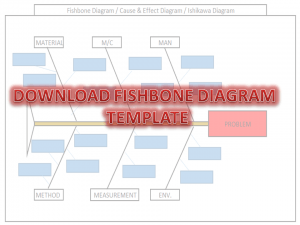
In this section, we are supposed to identify the significant cause of the potential cause. We have already identified the potential cause with the help of the CFT team and represented it through cause and effect diagram.
why why analysis methodology
To identify the significant cause from the above C&E Diagram, we need to use the methodology like brainstorming method, validation method, and hypothesis testing method. With the help of the brainstorming and validation method, we found that the “wrong gating system” is the significant cause. So now we will do the Why-why analysis by CFT team members.
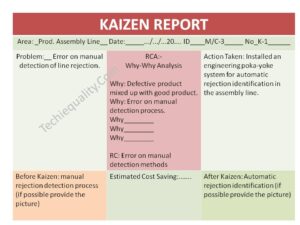
Problem: Wrong gating system.
Why wrong gating system?
Ans.: gating system was modified
Why gating system was modified?
Ans.: Gating system was modified w.r.t customer complaint but gating system was not validated before mass production.
Why gating system was not validated?
Ans.: There was no time to validate the part because production planning was scheduled without prior consideration of tool validation
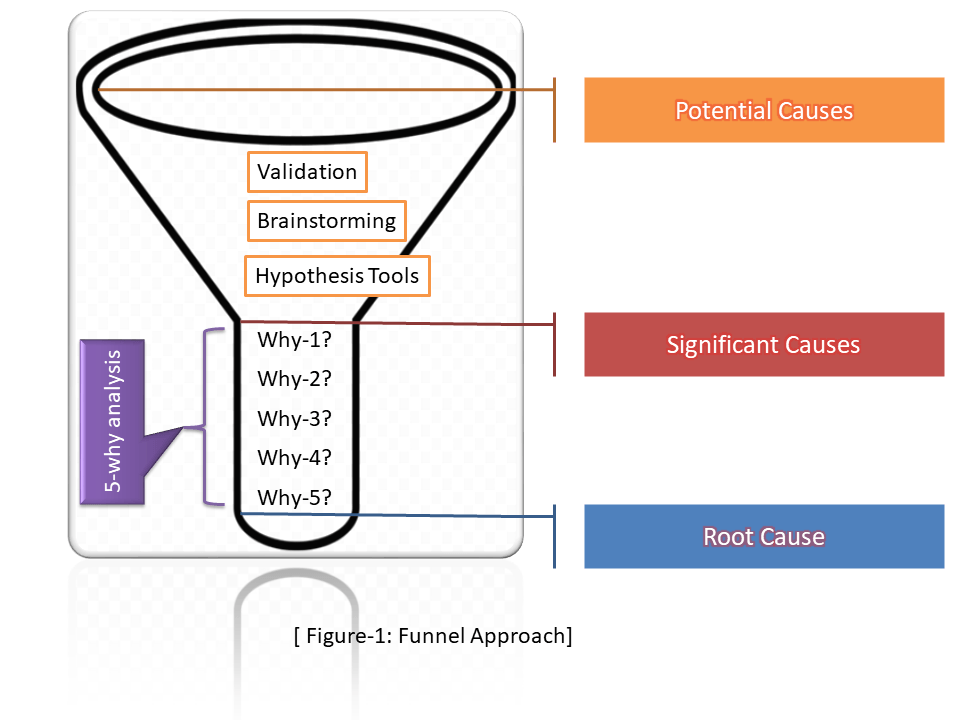
Once you identify the potential cause then we could also use the funnel approach to identify the Root cause by 5-why analysis.
In the above funnel diagram, we have mentioned three basic stages and applied some tools/ methods/ testing like validation, brainstorming, hypothesis testing, etc. to identify the significant cause in stage-2. and then applied the 5-why analysis to detect the Root cause in stage-3. In this way, we can use this approach to identify the RC.
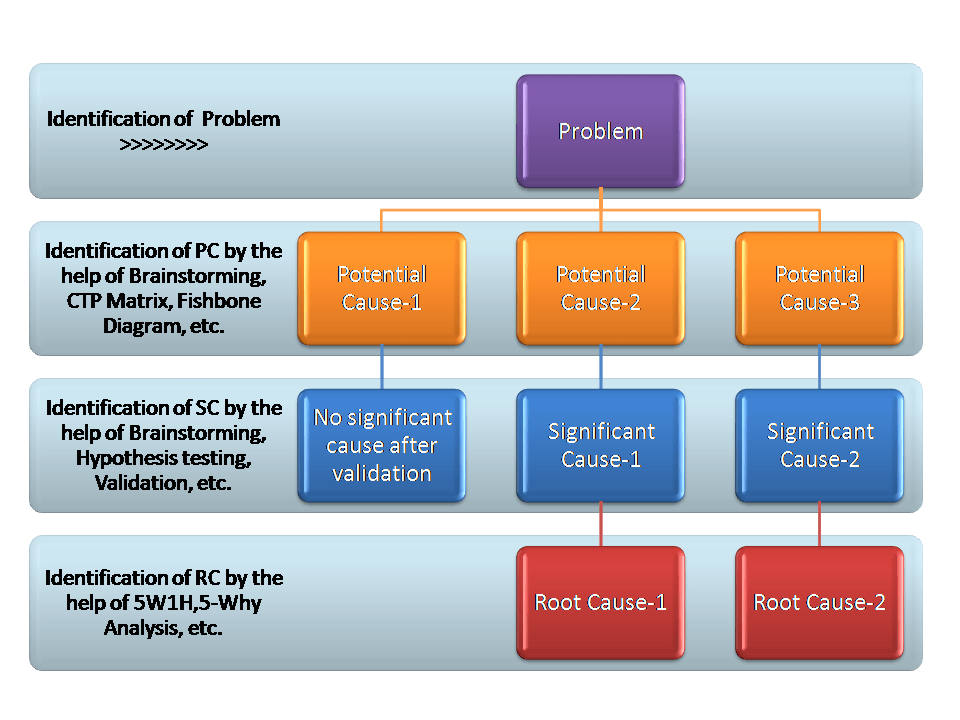
Why-Why Analysis Methodology to Identify the Multiple Root Cause:
In the above section, we learned the two different methodologies for why-why analysis. and in both case, we found a single root cause. we know that theoretically there will be a single root cause of a problem but technically there will be a minimum one root cause of a problem. So here we have mentioned in the below figure for the methodology to identify the multiple root causes.
Why-Why Analysis for Multiple Root Cause
Step-1: Identification and Understanding of the Problem
Step-2: CFT Team Formation and list up the Potential Causes by using tools like Brainstorming, CTP Matrix, Fishbone Diagram, etc.
Step-3: Significant Cause identification with the help of Brainstorming, Hypothesis Testing, Validation, etc.
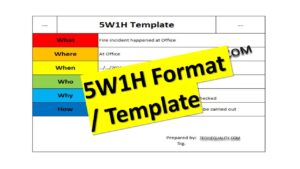
Step-4: Identification of Root Cause by why-why/ 5W1H analysis of each individual Significant Cause.
Shanti Gopal Pradhan is an experienced professional in Quality Management Systems, QA, Operations, Business Excellence, and Process Improvement. He has strong expertise in international standards including IATF 16949, ISO 9001, ISO 14001, ISO 45001, and ISO 17025, along with methodologies such as TQM, TPM, and Six Sigma.
He holds a degree in Mechanical Engineering along with an MBA, combining strong technical acumen with strategic business insight, he is a Certified Internal Auditor, Lead Auditor, and Six Sigma Black Belt, with a proven track record in driving quality transformation and operational excellence.
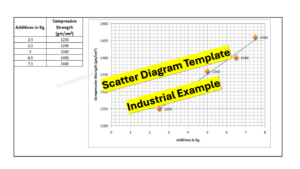
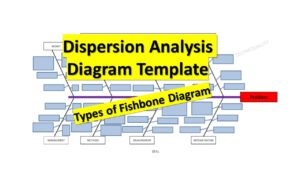
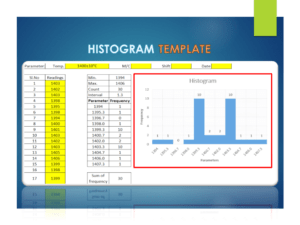
7QC tools are the most important tools that are used to analyze the Non-conforming products or services. As you know that the manufacturing process is a dynamic operation where common or special causes are always available at any extent. For analysis, the common and special cause’s 7QC tools are usually used. 7QC tools consist of [1] Pareto chart [2] Cause and Effect Diagram [3] Histogram [4] Scatter Diagram [5] Control Chart [6] Check sheet [7] Graph /Process flow. We have prepared a simple Excel template/ format and offering it here to our valuable readers to download these formats /templates. Links are given below to download the 7QC Tools Excel Template.
The Techiequality.Com has been helping its readers with all extensions to enhance their skills with best industrial practices w.r.t QA, QC, Six Sigma concept, Lean design, lean manufacturing, business excellence, 5’S, etc. So mentioned some posts below that you would love to read…
Shanti Gopal Pradhan is an experienced professional in Quality Management Systems, QA, Operations, Business Excellence, and Process Improvement. He has strong expertise in international standards including IATF 16949, ISO 9001, ISO 14001, ISO 45001, and ISO 17025, along with methodologies such as TQM, TPM, and Six Sigma.
He holds a degree in Mechanical Engineering along with an MBA, combining strong technical acumen with strategic business insight, he is a Certified Internal Auditor, Lead Auditor, and Six Sigma Black Belt, with a proven track record in driving quality transformation and operational excellence.