Six Sigma Green Belt Test Questions | 60+ Q&A with Example and Concept
Hi Readers, Today, we will be discussing an important topic on Six Sigma Green Belt Test Questions. Six Sigma Green Belt certification is one of the most recognized quality management credentials across manufacturing, automotive, healthcare, IT, logistics, and service industries. Green Belt professionals lead process improvement projects, reduce defects, improve customer satisfaction, and drive operational excellence using data-driven methodologies. This guide covers objective questions, practical questions, experience-based interview questions, and scenario-based questions with answers & examples.
Preparing for the green belt six sigma practice exam requires a strong understanding of:
- DMAIC Methodology
- Lean Principles
- Statistical Analysis
- Process Capability
- Root Cause Analysis
- Control Plans
- Continuous Improvement
- SIPOC
- VSM
- 7QC tools
- 5 core tools
- Hypothesis testing tools
The primary objectives of a green belt six sigma professional are:
- Reduce process variation.
- Eliminate defects and waste.
- Improve customer satisfaction.
- Increase process capability.
- Improve operational efficiency.
- Support organizational business goals.
- Lead DMAIC improvement projects.
Opportunity to lead and support nearly 200 improvement projects, including both Green Belt and Black Belt initiatives across various functions and industries.
Throughout this journey, I have gained extensive practical experience in problem-solving, process improvement, statistical analysis, project management, and business excellence methodologies. While certification examinations assess theoretical understanding, project execution provides invaluable insights that help professionals apply these concepts effectively.
To support both new and experienced professionals preparing for Six Sigma certification, I would like to share a collection of important and practical questions, along with key learning points, that are frequently encountered during project implementation and certification preparation. These questions are designed to strengthen conceptual understanding, enhance analytical thinking, and improve examination performance.
I hope this knowledge-sharing initiative will help aspiring Six Sigma professionals build confidence, deepen their expertise, and successfully achieve their certification goals while creating measurable business impact.
Wishing all certification aspirants the very best in their learning and professional development journey.
Basic Six Sigma Green Belt Objective Questions
1. What does DMAIC stand for?
A. Define, Measure, Analyse, Improve, Control
B. Develop, Measure, Assess, Improve, check
C. Define, Manage, Analyse, Implement, Control
D. Develop, Measure, Analyse, Improve, Confirm
Answer: A
2. What is Six Sigma primarily focused on?
A. Increasing inventory
B. Reducing variation and defects
C. Increasing manpower
D. Reducing production volume
Answer: B
3. Which phase identifies customer requirements?
A. Measure
B. Analyse
C. Define
D. Improve
Answer: C
4. What is CTQ?
A. Critical To Quality
B. Customer Technical Quality
C. Cost To Quality
D. Critical Team Quality
Answer: A
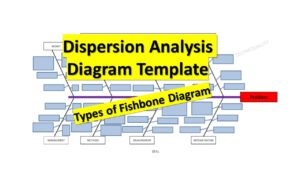
5. Which tool is commonly used for root cause analysis?
A. Fishbone Diagram
B. Histogram
C. Check Sheet
D. Control Plan
Answer: A
DMAIC Practical Questions
6. A production line has a defect rate of 8%. What DMAIC phase should be used to identify reasons for defects?
Answer: Analyse Phase
Explanation:
During Analyse, teams identify root causes using tools such as:
- Fishbone Diagram
- 5 Why Analysis
- Pareto Analysis
- Regression Analysis
7.Customer complaints have increased by 30%.Which DMAIC phase should begin first?
Answer: Define Phase
Reason:
The problem statement, project charter, scope, stakeholders, and customer requirements must first be defined.
Statistical Questions
8. What does a process capability index (Cpk) greater than 1.33 indicate?
A. Poor process performance
B. Marginal process capability
C. Capable process
D. Unstable process
Answer: C
9. What does standard deviation measure?
A. Average value
B. Process variation
C. Defect count
D. Yield
Answer: B
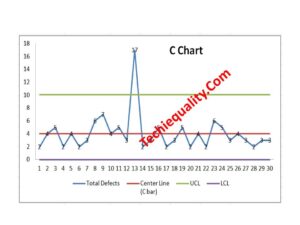
10. Which chart monitors variable data?
A. P Chart
B. C Chart
C. X-Bar Chart
D. NP Chart
Answer: C
11. What are the 8 wastes in Lean?
Answer:
- Defects
- Overproduction
- Waiting
- Non-utilized Talent
- Transportation
- Inventory
- Motion
- Extra Processing
Remember using acronym: DOWNTIME
12. What is Kaizen?
A. Statistical analysis
B. Continuous improvement
C. Process audit
D. Control chart
Answer: B
Scenario-Based Six Sigma Green Belt Test Questions
Scenario 1: Manufacturing Defect Reduction
Situation: An automotive component manufacturing plant reports:
- Monthly production = 10,000 units
- Defective units = 600
Management wants to reduce defects.
Question: Which Six Sigma approach should be applied?
Answer
DMAIC methodology.
Steps
Define
Problem: 6% defect rate causing customer complaints.
Measure
Collect defect data.
Analyse
Use:
- Pareto Chart
- Fishbone Diagram
- 5 Why Analysis
Improve
Implement:
- Operator training
- Process standardization
- Error proofing (Poka-Yoke)
Control
Monitor using control charts.
Expected Result
Defect rate reduced from 6% to below 2%.
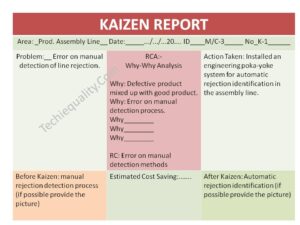
Scenario 2: AMR Manufacturing Example
Situation: An Autonomous Mobile Robot (AMR) manufacturer experiences recurring field failures due to Lidar connector looseness.
Question
How would you investigate?
Answer
Define
Field failures due to intermittent Lidar communication.
Measure
Collect:
- Failure frequency
- Failure location
- Operating hours
Analyse
Use 5 Why Analysis.
Example:
Why failure?
→ Connector disconnected.
Why disconnected?
→ Excessive vibration.
Why vibration affected connector?
→ Improper harness routing.
Why improper routing?
→ No routing standard.
Root Cause:
Lack of harness routing standard.
Improve
- Increase harness length.
- Improve bend radius.
- Add strain relief.
- Update assembly SOP.
Control
- Periodic audits.
- Validation testing.
- First-off inspection.
Scenario 3: Service Industry Example
Situation
Customer support ticket closure time increased from 24 hours to 72 hours.
Question
What Lean Six Sigma tools would you use?
Answer
- SIPOC
- Process Mapping
- Value Stream Mapping
- Pareto Analysis
- Root Cause Analysis
Likely findings:
- Resource shortage
- Approval delays
- Manual data entry
Experience-Based Six Sigma Green Belt Test Questions
1.Describe a Six Sigma project you completed.
Sample Answer
I led a defect reduction project in an automotive assembly process where defect rates were 4.5%.
Using DMAIC:
- Identified top defect categories
- Conducted root cause analysis
- Implemented process controls
Results:
- Defects reduced to 1.2%
- Annual savings of ₹25 Lakhs
- Improved customer satisfaction
Question 2: How have you used Pareto Analysis?
Sample Answer
In a manufacturing quality project, Pareto analysis revealed that 80% of defects originated from three defect categories.
Focusing corrective actions on these categories reduced overall defects by 50%.
Question 3
Explain a successful root cause analysis.
Sample Answer
We observed repeated AMR field failures.
Using:
- Fishbone Diagram
- 5 Why Analysis
We discovered improper cable routing causing connector stress.
After redesigning routing standards, failures dropped significantly.
Advanced Six Sigma Green Belt Test Questions
1. What is DPMO?
Defects Per Million Opportunities.
Formula:
DPMO = {Defects/ (Units x opportunities)}x1000000
2. What is a Sigma Level?
Sigma level measures process capability and defect performance.
Higher sigma = fewer defects. For example, 6 sigma = 3.4 defects per million
3. What is Poka-Yoke?
A mistake-proofing method designed to prevent human errors before defects occur.
Examples:
- Sensor-based assembly verification
- Barcode validation systems
Phase-wise Six Sigma Green Belt Test Questions
Define Phase Questions
1. What is the primary purpose of the Define phase?
Answer: To clearly define the problem, project scope, goals, customer requirements, and stakeholders.
2. What is a Project Charter?
Answer: A document that formally authorizes a Six Sigma project and includes:
- Problem Statement
- Business Case
- Goal Statement
- Scope
- Timeline
- Team Members
3. What is VOC?
Answer: Voice of Customer.
It represents customer expectations, needs, and requirements.
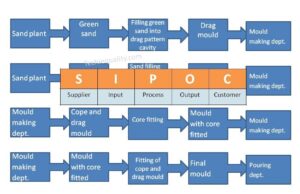
4. What is SIPOC?
Answer:
S – Suppliers
I – Inputs
P – Process
O – Outputs
C – Customers
Used to understand a process at a high level.
5. Why is a SIPOC diagram useful?
Answer:
It helps identify process boundaries and stakeholders before detailed analysis begins.
Measure Phase Questions
6. What is a Baseline Measurement?
Answer:
The current performance level before improvements is implemented.
7. Why is data collection important?
Answer:
Improvement decisions should be based on facts and data rather than assumptions.
8. What is a Check Sheet?
Answer:
A structured form used to collect and organize data.
9.What is Yield?
Yield = {Good units/Total units} x 100
Answer:
The percentage of defect-free products produced.
10. What is Rolled Throughput Yield (RTY)?
Answer:
The probability that a unit passes through an entire process without defects.
Analyse Phase Questions
11. What is Root Cause Analysis?
Answer:
A systematic method to identify the fundamental cause of a problem.
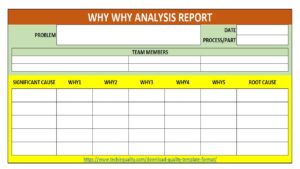
12. What is the 5 Why Technique?
Answer:
A problem-solving technique that repeatedly asks “Why?” until the root cause is identified.
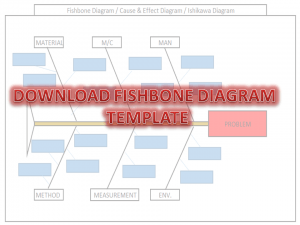
13. What is a Fishbone Diagram?
Answer:
A visual tool used to categorize potential causes of a problem.
Categories often include:
- Man
- Machine
- Method
- Material
- Measurement
- Environment
14. What is Pareto Analysis?
Answer:
A method based on the 80/20 rule where a small number of causes contribute to most problems.
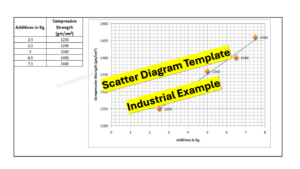
15. What is Correlation?
Answer:
A measure showing the relationship between two variables.
Improve Phase Questions
16. What is Poka-Yoke?
Answer:
Mistake-proofing techniques that prevent errors from occurring.
Example:
A connector designed to fit only in one direction.
17. What is Kaizen?
Answer:
Continuous improvement through small incremental changes.
18. Why conduct pilot runs?
Answer:
To verify improvements before full implementation.
19. What is Cost of Poor Quality (COPQ)?
Answer:
Costs associated with defects, rework, scrap, warranty claims, and customer complaints.
20. What is Risk Assessment?
Answer:
The process of identifying and evaluating potential risks before implementing changes.
Control Phase Questions
21. What is a Control Plan?
Answer:
A document that ensures process improvements are sustained.
22. What is Statistical Process Control (SPC)?
Answer:
A method of monitoring and controlling processes using statistical tools.
23. What is a Control Chart?
Answer:
A graph used to monitor process stability over time.
24. What are Upper and Lower Control Limits?
Answer:
Boundaries indicating expected process variation.
25. Why is process standardization important?
Answer:
It ensures consistency and prevents recurrence of defects.
Statistical Questions
26. What is Mean?
Answer:
The average of a dataset.
27. What is Median?
Answer:
The middle value when data is arranged in order.
28. What is Mode?
Answer:
The value that occurs most frequently.
29. What is Standard Deviation?
Answer:
A measure of variation or spread in a dataset.
30. Why is a low standard deviation desirable?
Answer:
It indicates consistent process performance.
Process Capability Questions
31. What does Cp measure?
Answer:
Potential process capability.
32. What does Cpk measure?
Answer:
Actual process capability considering process centering.
33. What does Cpk less than 1 indicate?
Answer:
The process is not capable of consistently meeting specifications.
34. What is considered a good Cpk value?
Answer:
Generally, 1.33 or higher.
35. Why monitor process capability?
Answer:
To determine whether the process can meet customer requirements.
Lean Six Sigma Questions
36. What is Value-Added Activity?
Answer:
An activity the customer is willing to pay for.
37. What is Non-Value-Added Activity?
Answer:
An activity that consumes resources without adding customer value.
38. What is Value Stream Mapping?
Answer:
A visual representation of material and information flow.
39. What is Takt Time?
Take Time = Available Production Time/Customer Demand
40. What is Just-In-Time (JIT)?
Answer:
Producing only what is needed, when needed, in the required quantity.
Scenario-Based Questions
41. Scenario: AMR Battery Failure
An AMR battery is failing after 100 charging cycles instead of the specified 500 cycles.
Question: Which Six Sigma tools would you use?
Answer:
- Pareto Analysis
- Fishbone Diagram
- 5 Why Analysis
- DOE (Design of Experiments)
- Process Capability Analysis
42. Scenario: High Dispatch Errors
Warehouse dispatch accuracy dropped from 99% to 94%.
Answer:
Investigate:
- Picking process
- Barcode scanning
- Training effectiveness
- Standard operating procedures
43. Scenario: Customer Complaints Increased
Complaints increased by 40%.
Question: What should be your first step?
Answer:
Collect VOC data and define the problem clearly.
44. Scenario: Production Cycle Time Increased
Cycle time increased from 5 minutes to 8 minutes.
Answer:
Perform:
- Time Study
- Process Mapping
- Bottleneck Analysis
- Value Stream Mapping
45. Scenario: Rework Increased
A manufacturing process shows increasing rework levels.
Answer:
Analyse:
- Operator skill
- Machine condition
- Incoming material quality
- Process parameters
46. How did Six Sigma help your organization?
Sample Answer:
Six Sigma reduced defect rates by identifying root causes and implementing process controls, resulting in improved customer satisfaction and cost savings.
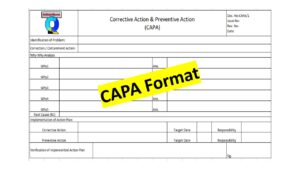
47. Describe a successful CAPA project.
Sample Answer:
Field failures were traced to improper cable routing. We updated design standards, implemented training, and established validation checks. Failures reduced significantly.
48. How do you handle resistance to change?
Sample Answer:
By involving stakeholders early, presenting data-based evidence, and demonstrating benefits through pilot projects.
49. How do you prioritize improvement opportunities?
Sample Answer:
Using Pareto Analysis, risk assessment, customer impact, and business value.
50. What is the biggest mistake in Six Sigma projects?
Answer:
Jumping directly to solutions without:
- Defining the problem clearly
- Collecting accurate data
- Identifying the true root cause
This often leads to ineffective corrective actions and recurring problems.
A process produces 50,000 units with 250 defects. Each unit has 5 defect opportunities.
Calculate DPMO.
DPMO = {250 x 1000000 /(50000 x 5)}
Answer:
DPMO = 1,000
Basic Hypothesis Testing Six Sigma Green Belt Test Questions
Hypothesis testing is a critical topic in Six Sigma Green Belt certification exams. It helps determine whether process changes, supplier differences, machine variations, or quality improvements are statistically significant.
1. What is Hypothesis Testing?
Answer:
Hypothesis testing is a statistical method used to determine whether a claim about a population is likely to be true based on sample data.
2. What are the two hypotheses used in hypothesis testing?
Answer:
Null Hypothesis (H₀):
Assumes no difference or no effect exists.
Alternative Hypothesis (H₁ or Ha):
Assumes a difference or effect exists.
Example:
H₀: New process cycle time = Old process cycle time
H₁: New process cycle time ≠ Old process cycle time
3. What is the purpose of the Null Hypothesis?
Answer:
The null hypothesis serves as the default assumption that there is no significant difference between groups or processes.
4. What is a P-value?
Answer:
The probability of obtaining the observed result if the null hypothesis is true.
Decision Rule
- P-value ≤ 0.05 → Reject H₀
- P-value > 0.05 → Fail to Reject H₀
5. What is the significance level (α)?
Answer:
The maximum acceptable risk of rejecting a true null hypothesis.
Common value:
α = 0.05 (5%)
Type I and Type II Error Questions
6. What is a Type I Error?
Answer:
Rejecting a true null hypothesis.
Example:
Concluding a new supplier is better when actually there is no difference.
7. What is a Type II Error?
Answer:
Failing to reject a false null hypothesis.
Example:
Concluding there is no supplier difference when one actually exists.
8. Which error is called “False Alarm”?
Answer:
Type I Error.
9. Which error is called “Missed Detection”?
Answer:
Type II Error.
One-Tailed and Two-Tailed Test Questions
10. When is a One-Tailed Test used?
Answer:
When the direction of change is important.
Example:
Testing whether a new process reduces defects.
H₁: Defect Rate < Current Defect Rate
11. When is a Two-Tailed Test used?
Answer:
When testing for any difference.
Example:
H₁: Mean Cycle Time ≠ Existing Cycle Time
t-Test Questions
12. What is a One-Sample t-Test?
Answer:
Compares a sample mean against a target value.
Example:
Target Cycle Time = 20 min
Sample Mean = 18 min
13. What is a Two-Sample t-Test?
Answer:
Compares means of two independent groups.
Example:
Machine A vs Machine B
14. What is a Paired t-Test?
Answer:
Compares measurements before and after a process change on the same sample.
Example:
Cycle time before automation and after automation.
15. A process improvement project resulted in a p-value of 0.02. What should be concluded?
Answer:
Since:
0.02 < 0.05
Reject H₀.
The improvement is statistically significant.
ANOVA Questions
16. What does ANOVA stand for?
Answer:
Analysis of Variance
17. When is ANOVA used?
Answer:
To compare means of three or more groups.
Example:
Comparing output from:
- Machine A
- Machine B
- Machine C
18. What is the Null Hypothesis in ANOVA?
Answer:
H₀:
All group means are equal.
19. What is the Alternative Hypothesis in ANOVA?
Answer:
At least one group mean is different.
Chi-Square Test Questions
20. When is Chi-Square used?
Answer:
For categorical data.
Example:
Determining whether defect type depends on production shift.
21. Give an example of a Chi-Square Test.
Answer:
Testing whether:
- Day Shift
- Night Shift
have different defect distributions.
22. Scenario: New Supplier Approval
Supplier A defect rate = 2%
Supplier B defect rate = 4%
Question:
Which test should be used?
Answer:
2-Proportion Test
Because defect rates are proportions.
23. Scenario: Comparing Machine Outputs
Three machines produce the same component.
Question:
Which test should be used?
Answer:
ANOVA
Since more than two groups are being compared.
24. Scenario: Before and After Improvement
Cycle time before improvement = 15 min
Cycle time after improvement = 12 min
Question:
Which test should be used?
Answer:
Paired t-Test
25. Scenario: Process Target Verification
Target weight = 100 g
Sample average = 98 g
Question:
Which test should be used?
Answer:
One-Sample t-Test
Six Sigma Green Belt Ultimate Quick Memory Tricks
DMAIC = Roadmap of Six Sigma
Memory Trick:
D M A I C
Define → What is the problem?
Measure → How bad is it?
Analyse → Why is it happening?
Improve → Fix it.
Control → Sustain it.
Easy Phrase:
“Define, Measure, Analyse, Improve, Control”
Problem → Data → Cause → Solution → Sustain
8 Wastes of Lean
Memory Trick:
DOWNTIME
| Letter | Waste |
| D | Defects |
| O | Overproduction |
| W | Waiting |
| N | Non-utilized Talent |
| T | Transportation |
| I | Inventory |
| M | Motion |
| E | Extra Processing |
Root Cause Analysis
Memory Trick:
5 Why = Dig Until Root Cause
Problem → 1Why? → 2Why? →–3Why? -→ 4Why? → 5Why?
Never stop at symptoms.
4. Fishbone Categories
Memory Trick:
6M
- Man
- Machine
- Method
- Material
- Measurement
- Mother Nature (Environment)
Process Capability
Memory Trick:
Cp = Potential
Cpk = Actual Performance
Think: “Cpk keeps process centered.”
Green Belt Thumb Rule
| Cpk | Meaning |
| <1 | Poor |
| 1.0 | Barely Capable |
| 1.33 | Good |
| 1.67+ | Excellent |
6 Sigma = 3.4 defects per million
This is the most frequently asked Six Sigma exam question.
Hypothesis Testing Shortcut
P-Value Rule
P ≤ 0.05 → Reject H₀
P > 0.05 → Fail to Reject H₀
Memory Trick
Small P = Big Difference
Control Charts
Memory Trick
Variable Data: X-Bar & R Chart
Examples:
- Weight
- Length
- Voltage
Attribute Data: P, NP, C, U Charts
Examples:
- Defects
- Rejects
- Pass/Fail
Pareto Principle
Memory Trick
80/20 Rule
80% Problems ← 20% Causes
Focus on the “Vital Few.”
Cost of Quality (COQ)
Memory Trick: PAFF
| Letter | Meaning |
| P | Prevention |
| A | Appraisal |
| F | Internal Failure |
| F | External Failure |
Thanks for Reading… Keep visiting TECHIEQUALITY.

Shanti Gopal Pradhan is an experienced professional in Quality Management Systems, QA, Operations, Business Excellence, and Process Improvement. He has strong expertise in international standards including IATF 16949, ISO 9001, ISO 14001, ISO 45001, and ISO 17025, along with methodologies such as TQM, TPM, and Six Sigma.
He holds a degree in Mechanical Engineering along with an MBA, combining strong technical acumen with strategic business insight, he is a Certified Internal Auditor, Lead Auditor, and Six Sigma Black Belt, with a proven track record in driving quality transformation and operational excellence.