What is SPC | SPC Tools
What is SPC ? SPC is the Statistical Process Control.
History and Definition:-
Statistical Process Control is a technique of quality control that services statistical methods to monitor and control processes. This ensures the process stability and consistency, producing more conforming products with less waste (Defects free). SPC helps us to indicate the common and special cause’s presence in the process. SPC is generally focused on continuous improvement.
Statistical Process Control was established by Walter A. Shewhart at Bell Laboratories in the year 1920 and he developed the control chart in 1924.
The control chart is the key tool for statistical process control. The control chart is used on both variable and attribute-type data.
Here is the full description of What is SPC?
Benefits of Statistical Process Control:-
- Optimize the productivity
- Reduced scrap, rework, warranty, and defects
- Increased efficiency
- Improved customer satisfaction
- Improved the Process capability
- Reduced COPQ.
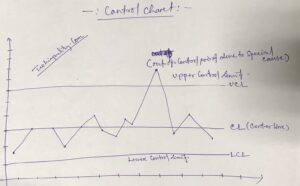
Control Chart-
- A line on a control chart is used as a basis for judging the stability of a process. If the Measure points are beyond a control limit(UCL, LCL) then it evidences that special causes are affecting the process.
- Control Charts can be used to evaluate a process.
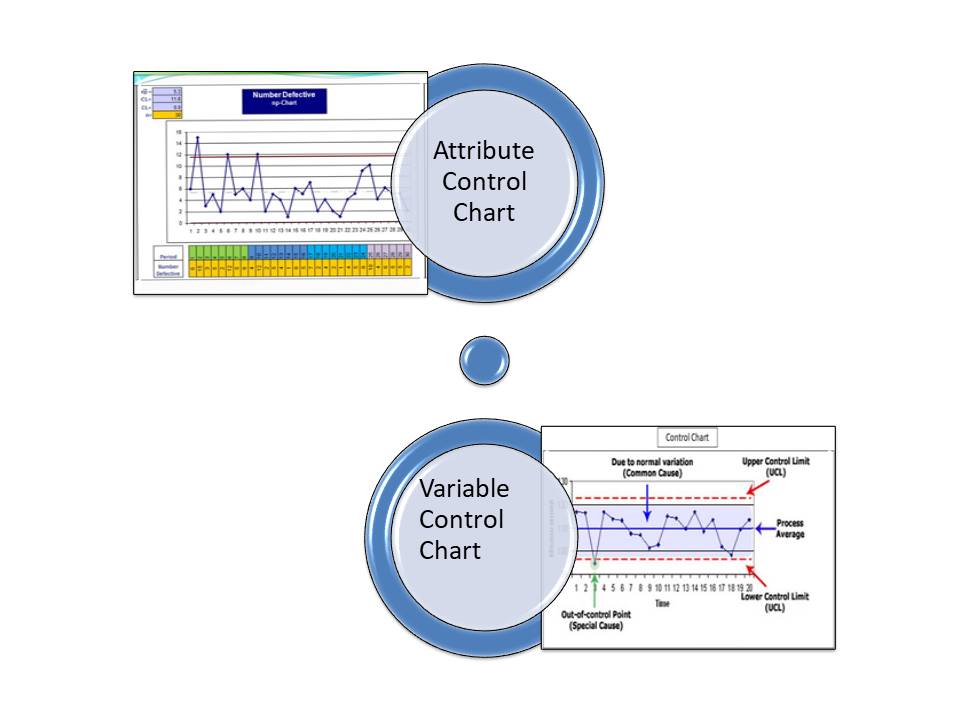
- There are basically two types of control charts, for variable data and attribute data.
The use of statistical techniques such as control charts to analyze a process, so as to take appropriate actions to improve the process capability.
Nomenclature of Control chart:
Selection of Control Charts based on Attribute / Variable Type Data-
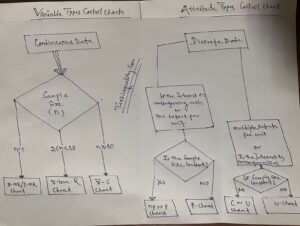
Variables Control chart:
Average and Range Chart (X͞ and R):
Subgroup Average:
X͞ =(x1+x2+x3+…+xn)/n
n= number of samples in subgroup
Subgroup Range:
R= Xmax-Xmin (Within each subgroup)
Grand Average:
X͞͞ ͞ = (͞x1+x͞2+…+x͞k)/k
k=number of subgroups used to determine the grand average and average range.
Average Range:
R͞ =(R͞1+ R͞2+…R͞k)/k
Estimate of the standard deviation of X:
Standard Deviation =R͞ /d2
Estimate of the standard deviation of X͞: =(R͞ /d2 )/√n
Centre line:
CLx͞ = X͞ ͞
Centerline of Range =R͞
Control Limits:
UCLx͞ = X͞ ͞ +A2R͞
Upper control limit of Range = D4R͞
Lower Control limits of X͞ = X͞ ͞ -A2R͞
Lower Control limit of Range=D3R͞.
(For Subgroup size 5, A2=0.577, d2=2.326, D4=2.114)
Attributes control Chart:
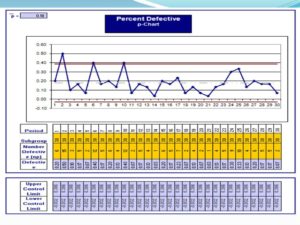
P chart (for proportions of units in a category)
Centre line = P͞
Control limits:
Samples not necessarily of constant size
Upper control limits: P͞ +3x √(p͞(1-p͞)/√n)
Lower Control limits: P͞ -3x √(p͞(1-p͞)/√n)
If the sample size is constant (n):
Upper control limits: P͞ +3x √(p͞(1-p͞)/√n)
Lower Control limits: P͞ -3x √(p͞(1-p͞)/√n)
Different types of Attributes type control chart:
[P-Chart]
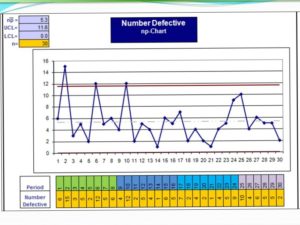
[np-Chart]
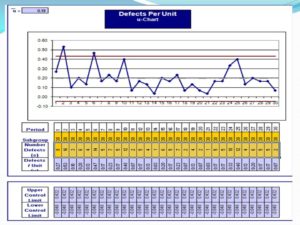
[u-chart]
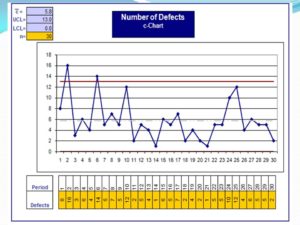
[c-chart]
In the Above c-types Control chart, two numbers observe points are fall outside of upper control limits, this means the control chart gives an alarm that the process has some special cause that we need to take immediate action to control the process in stable conditions.
Interpretation of Result (Both Attributes and Variable types Data Control chart):
The Control Charts would indicate that a process is out of Control if either one of these is true-
- One or More points fall outside the Control Limits
- When the Control Charts are divided into 3 sigma zones –
- Nine Consecutive points are on one side of the average
- There are six Consecutive points, increasing or decreasing.
- There are fourteen consecutive points that alternate up or down.
The SPC- Statistical process control is one of the best methodologies to control the process. It is commonly used in manufacturing industries for process control & improvement.
FAQ:
What is an SPC used for?
The SPC is a statistical process control that is used for process control by statistical techniques/methods/tools. (like a control chart, process capability, etc).
Thank you for visiting the Website Techiequality.com.
Once again thank you so much……
Popular Post:

Shanti Gopal Pradhan is an experienced professional in Quality Management Systems, QA, Operations, Business Excellence, and Process Improvement. He has strong expertise in international standards including IATF 16949, ISO 9001, ISO 14001, ISO 45001, and ISO 17025, along with methodologies such as TQM, TPM, and Six Sigma.
He holds a degree in Mechanical Engineering along with an MBA, combining strong technical acumen with strategic business insight, he is a Certified Internal Auditor, Lead Auditor, and Six Sigma Black Belt, with a proven track record in driving quality transformation and operational excellence.