How to measure process performance (Pp & Ppk)?
Hello Readers, Today we will learn “how to measure process performance?” Process Performance and its index can be measured by calculating the value manually or by using an Excel sheet or by using the software. In this post, we will calculate the Pp and Ppk value, but you can download the free Excel template or format for your ready reference, this offer is available for a limited time period! Don’t waste your time; just download the Format or Template from the below link.
DOWNLOAD the
| How to use Step-1: Download the Template/ Format from the above links. Step-2: Read the note mentioned in excel template. Step-3: Only the yellow color box (mentioned in Template) is changeable and other values will calculate automatically. |
How to measure process performance (Pp & Ppk)?
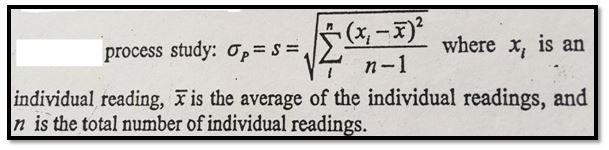
As you know we have already told you that process performance and its index can be easily measured through an Excel sheet or by using the software. For manual calculation, we have to give more attention in basic knowledge and formula part. So, Pp and Ppk formula is given below, kindly go through it.
Formula of Pp (Process Performance):
Pp = ((USL-LSL)/ (6 X S))
[Where USL=Upper specification limit, LSL=Lower specification limit and S= Standard Deviation]
The formula of Ppk (Process Performance Index):
Ppk = Minimum of PPU or PPL
PPU= ((USL-Average of average)/ (3 X S))
PPL= ((Average of average-LSL)/ (3 X S))
Note: Pp ≥ Ppk.
Example:
A process engineer has collected 100 numbers of readings of molten grey cast iron carbon percentage.
Details of readings are given below:
| Sl.No. | 1 | 2 | 3 | 4 | 5 | 6 | 7 | 8 | 9 | 10 |
| Subgroup1 | 3.22 | 3.28 | 3.21 | 3.23 | 3.27 | 3.24 | 3.24 | 3.22 | 3.24 | 3.28 |
| Subgroup2 | 3.21 | 3.29 | 3.26 | 3.23 | 3.28 | 3.21 | 3.26 | 3.21 | 3.26 | 3.29 |
| Subgroup3 | 3.25 | 3.23 | 3.24 | 3.21 | 3.29 | 3.25 | 3.24 | 3.23 | 3.25 | 3.27 |
| Subgroup4 | 3.20 | 3.20 | 3.25 | 3.25 | 3.25 | 3.26 | 3.26 | 3.22 | 3.26 | 3.27 |
| Subgroup5 | 3.21 | 3.25 | 3.26 | 3.28 | 3.24 | 3.21 | 3.28 | 3.21 | 3.25 | 3.28 |
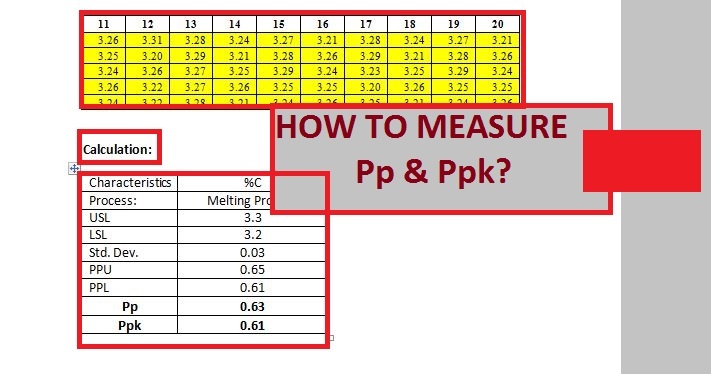
| 11 | 12 | 13 | 14 | 15 | 16 | 17 | 18 | 19 | 20 |
| 3.26 | 3.31 | 3.28 | 3.24 | 3.27 | 3.21 | 3.28 | 3.24 | 3.27 | 3.21 |
| 3.25 | 3.20 | 3.29 | 3.21 | 3.28 | 3.26 | 3.29 | 3.21 | 3.28 | 3.26 |
| 3.24 | 3.26 | 3.27 | 3.25 | 3.29 | 3.24 | 3.23 | 3.25 | 3.29 | 3.24 |
| 3.26 | 3.22 | 3.27 | 3.26 | 3.25 | 3.25 | 3.20 | 3.26 | 3.25 | 3.25 |
| 3.24 | 3.22 | 3.28 | 3.21 | 3.24 | 3.26 | 3.25 | 3.21 | 3.24 | 3.26 |
Calculation:
| Characteristics | %C |
| Process: | Melting Process |
| USL | 3.3 |
| LSL | 3.2 |
| Std. Dev. | 0.03 |
| PPU | 0.65 |
| PPL | 0.61 |
| Pp | 0.63 |
| Ppk | 0.61 |
Similar Post:
Process Performance Example (Pp) & Ppk |Download Format
How to calculate process performance (Pp & Ppk)?
Process Performance (Pp) & Ppk Excel Template |DOWNLOAD
More on TECHIEQUALITY


Thank you for reading. Keep visiting Techiequality
Popular Post:

Shanti Gopal Pradhan is an experienced professional in Quality Management Systems, QA, Operations, Business Excellence, and Process Improvement. He has strong expertise in international standards including IATF 16949, ISO 9001, ISO 14001, ISO 45001, and ISO 17025, along with methodologies such as TQM, TPM, and Six Sigma.
He holds a degree in Mechanical Engineering along with an MBA, combining strong technical acumen with strategic business insight, he is a Certified Internal Auditor, Lead Auditor, and Six Sigma Black Belt, with a proven track record in driving quality transformation and operational excellence.