Implementation of KAIZEN in Industry:
Implementation of KAIZEN in Industry is the most important key to the Industry for Continuous Improvement in any type of Loss or Waste. But the sustaining of any type of kaizen is the question mark for the industry. Many industries try their best to implement the kaizen at the initial stage is become successful. but sustaining the continuous improvement program is very difficult. Kaizen is the Key Input to all types of Business system standards. We will discuss here details about the comprehensive steps of the KAIZEN implementation program and its Sustainability.
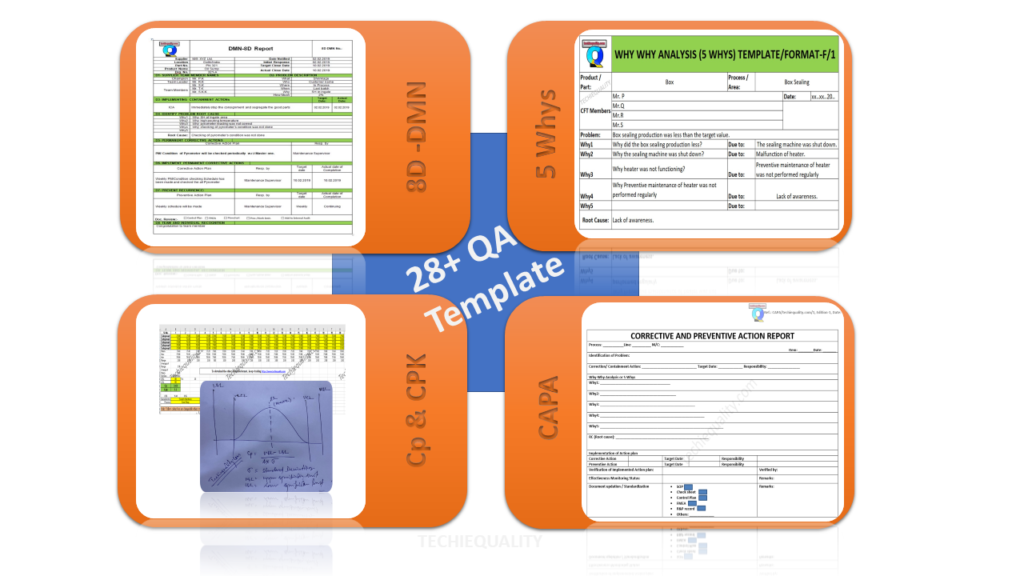
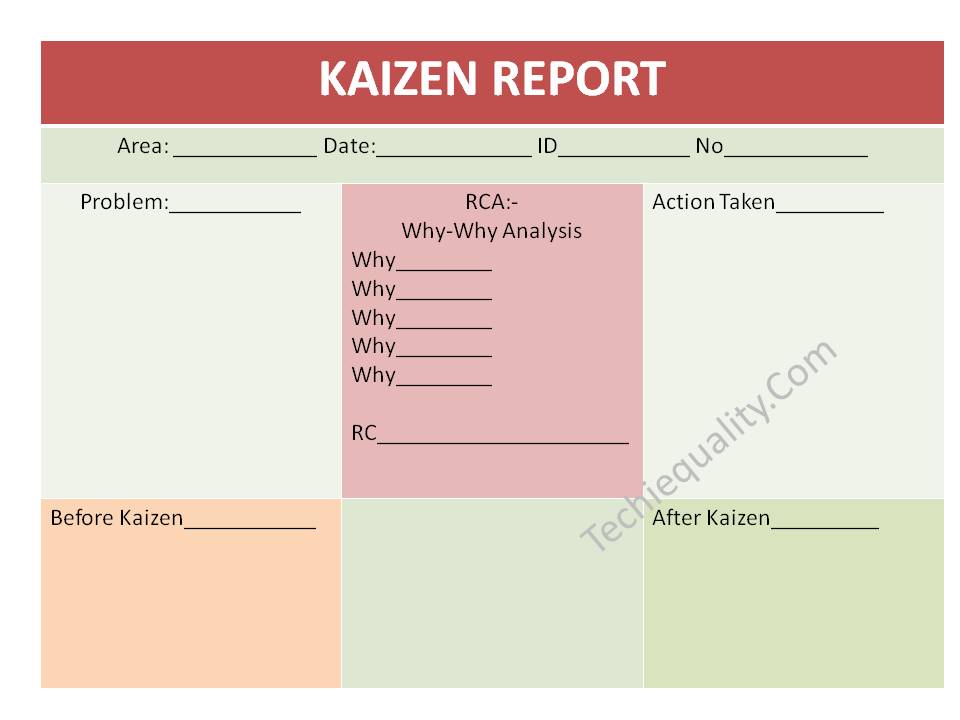
Download the KAIZEN report template or format.
Step-1: Identify the Big Losses or Wastage in process or Areas
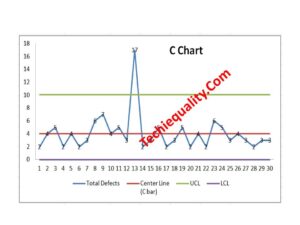
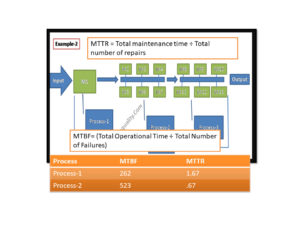
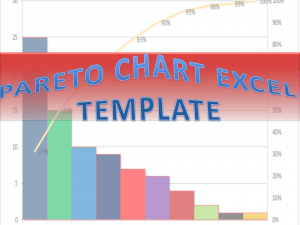
Based on the Historical data you have to select the higher contribution losses among the sets of different types of Losses in a particular process where you would like to Improve. Basically, the Pareto chart you can use to identify the Loss contribution among the sets of losses.
Step-2 Formation of Team
It is the same as what generally all types of project teams are made. The Process or Section In-charge will be the leader of the Kaizen Project. and other team members should be from different functions such as production, quality, development, maintenance, etc. Now leader will give contributions to clarify the individual roles and responsibilities of each and every member. Responsibility and Activity Matrix need to be prepared before going to the next step. Here is one example of an Activity matrix.
Activity Matrix of Kaizen:
Activity Matrix is the helping tool for the successful Implementation of KAIZEN in Industry Download Activity Matrix of Kaizen.
Step-3 Collection of Data
Before collecting data, you have to identify the potential cause of the problem. Data need to be collected for a better understanding of the correlation between potential causes and problems.
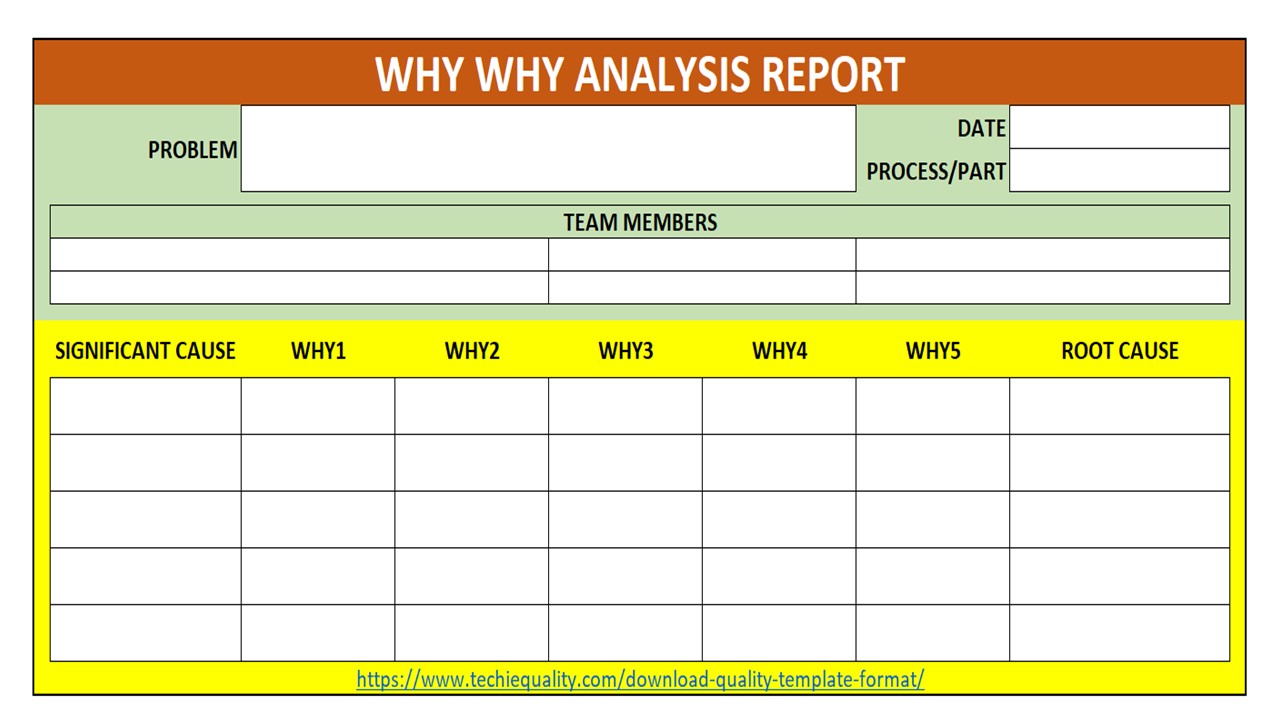
Step-4 Analysis
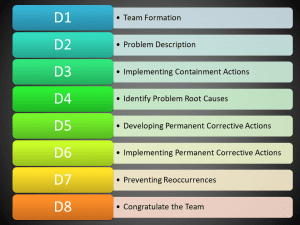
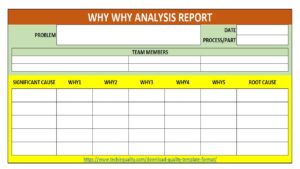
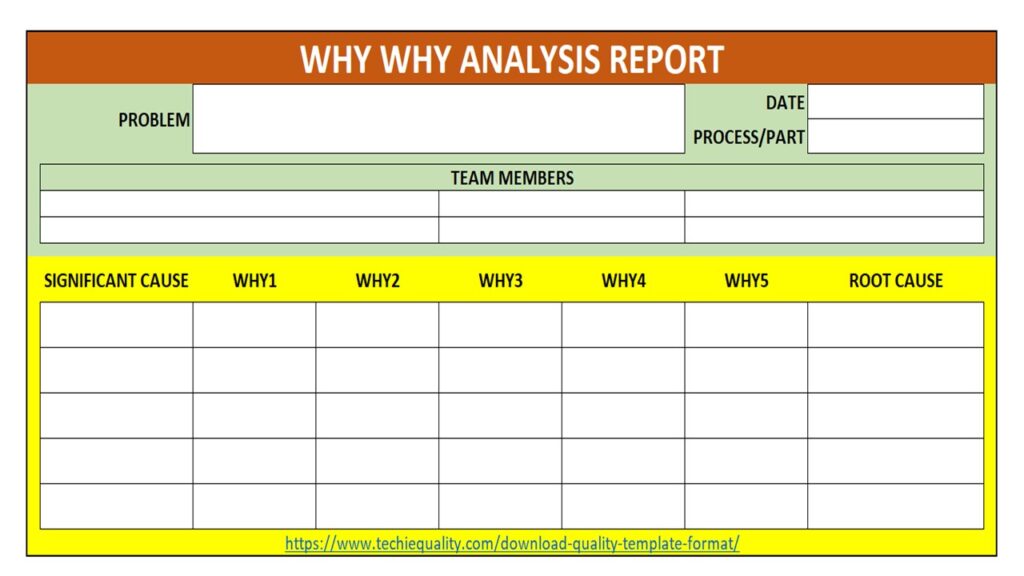
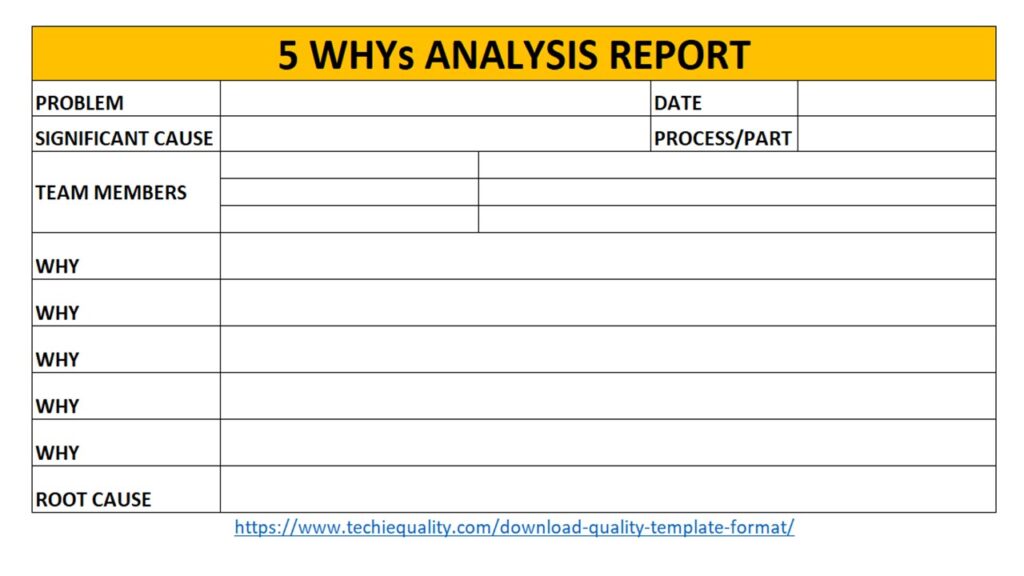
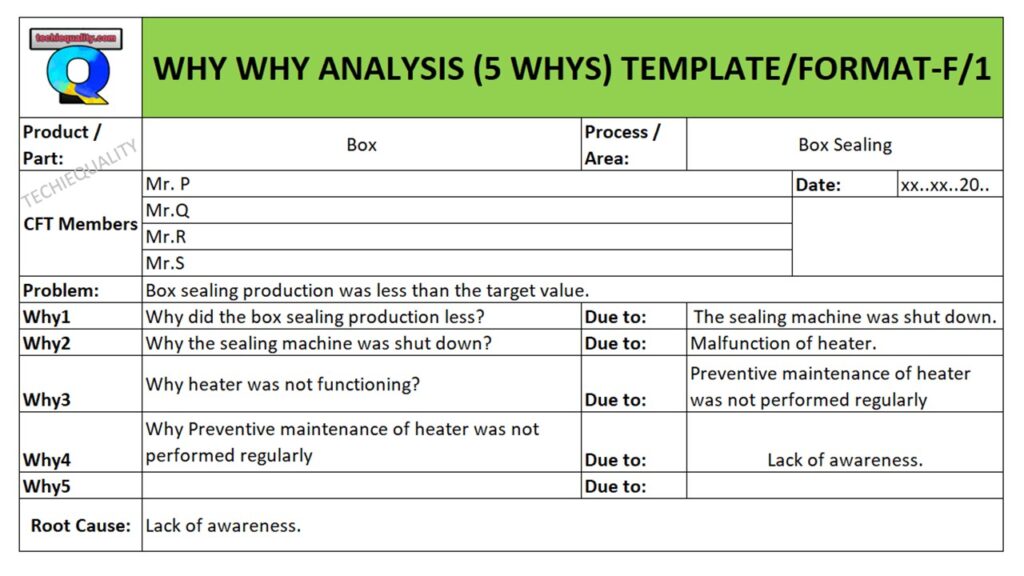
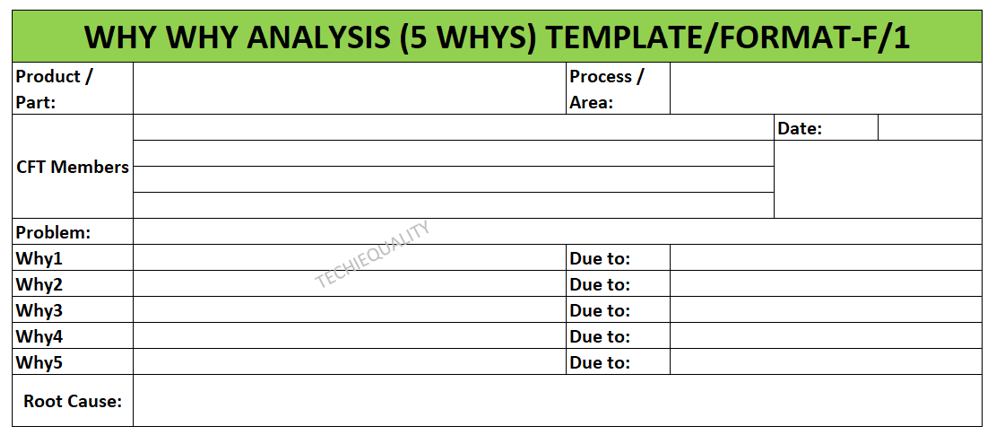
This step is the most important step for action. Here you have to do a why-why analysis. And need to follow the narrow steps of Brainstorming to identify the Root cause through the involvement of each individual member of the team.
Step-5 Implementation of Project
Here aforesaid Kaizen Activity Matrix needs to be executed for the successful implementation of the Project or you can also be laid down the milestone chart or Gantt chart for the implementation of the project. During the Project implementation budget needs to be considered.
Step-6 Achievement of Kaizen Goal
Check up on the result of kaizen and also effectiveness. Address the Tangible and Intangible benefits.
Step-7 Standardization
The job is not over yet. here you have to prepare the SOP, Fill up the Kaizen template, need to impart awareness about Kaizen’s benefits, etc. This will call for making those a working system. Horizontal deployment over a similar area will give you the strength of the organization as cumulative tangible and intangible benefits.
Step-8 Sustenance
In step Sustenance, Sustainability Kaizen audit on a minimum monthly basis needs to be carried out.
Kaizen Examples:
as you know Kaizen is the best practice in the manufacturing industries for continuous improvement. I am sharing here my own experience that how I was identifying the kaizen idea in several operational areas.
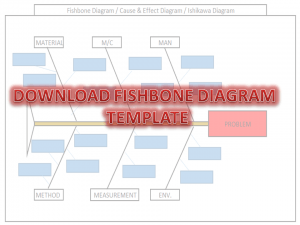
when I was involved in shop floor manufacturing activities, every day on the morning shift I was analyzing the line rejection with details cause, and periodically did the Q component inspection. after doing the analysis and several types of Gemba auditing, finally, I was preparing problems identified report w.r.t man, machine, methods, material, and other factors for kaizen idea / continuous improvement purpose. discussed all problems related to the concerns department and collected their suggestions/improvement points. Given below is the kaizen methodology that you can follow to implement kaizen in your work zone.
- List out the current problems, and issues in your work areas.
- Find out the opportunities.
- Categories the problems and find out which one is fit for Kaizen.
- Do the Why-Why analysis.
- Find out the Root causes
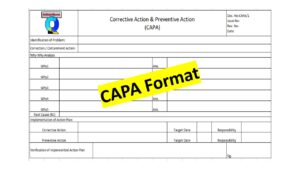
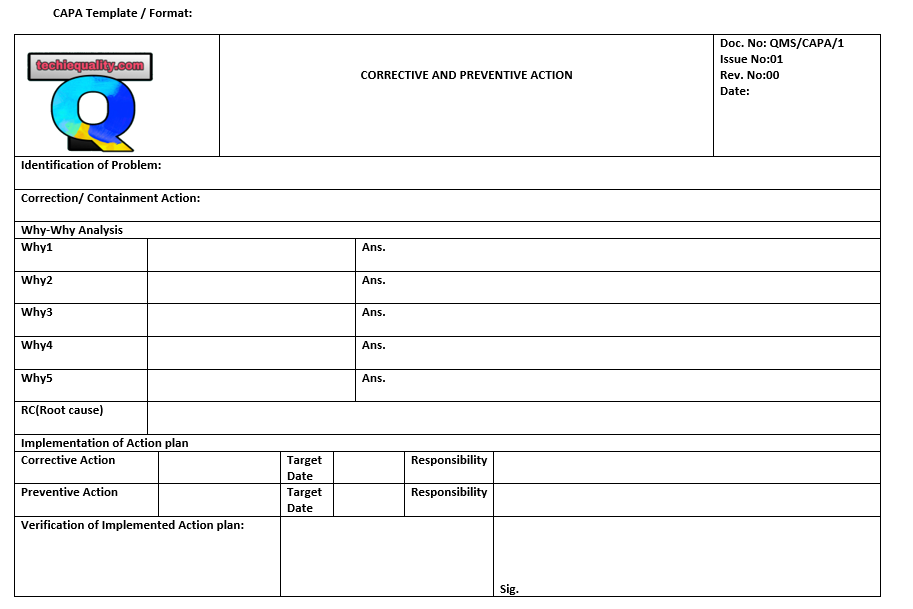
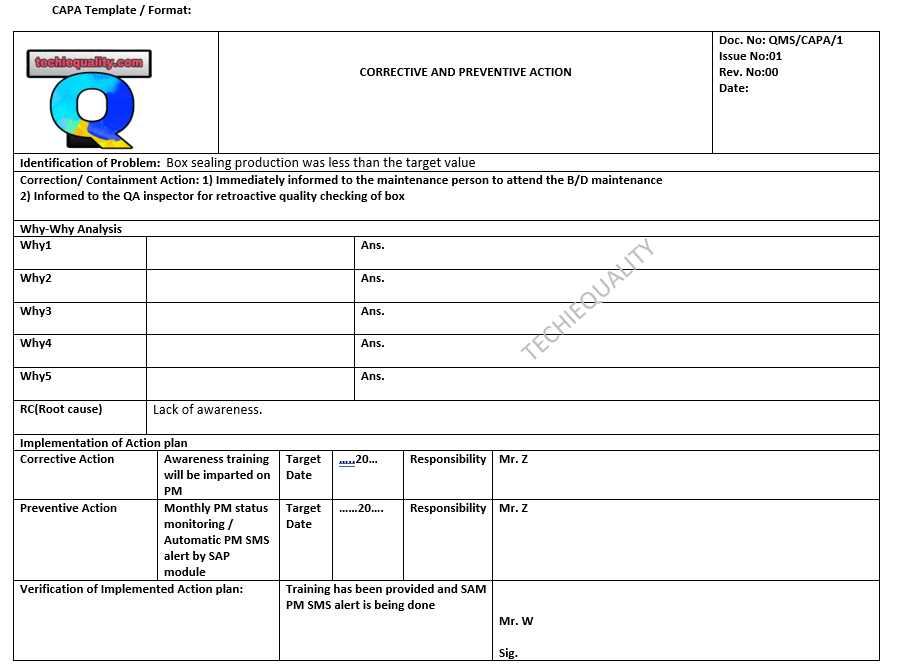
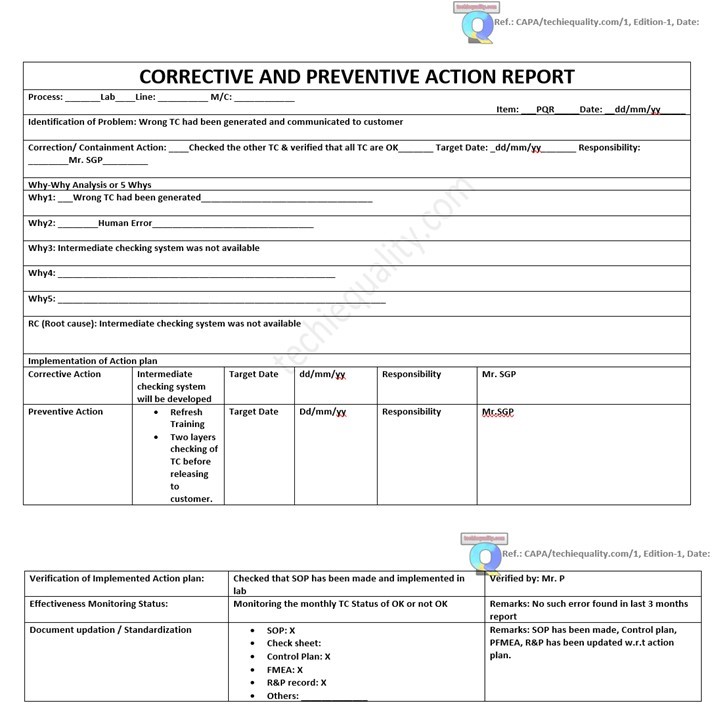
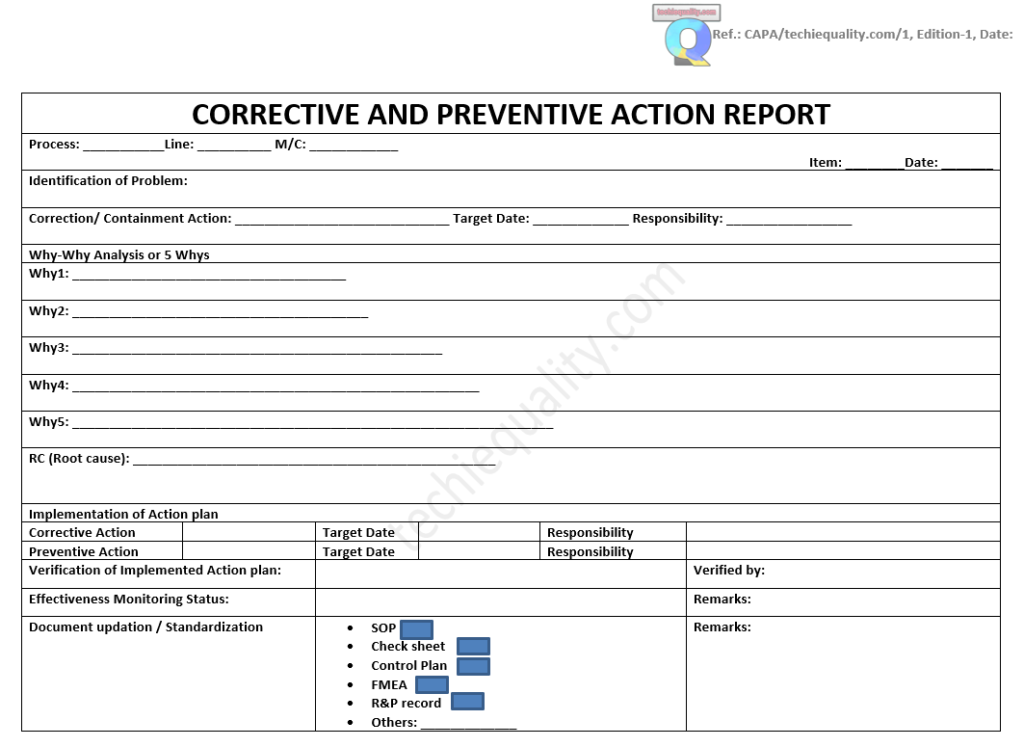
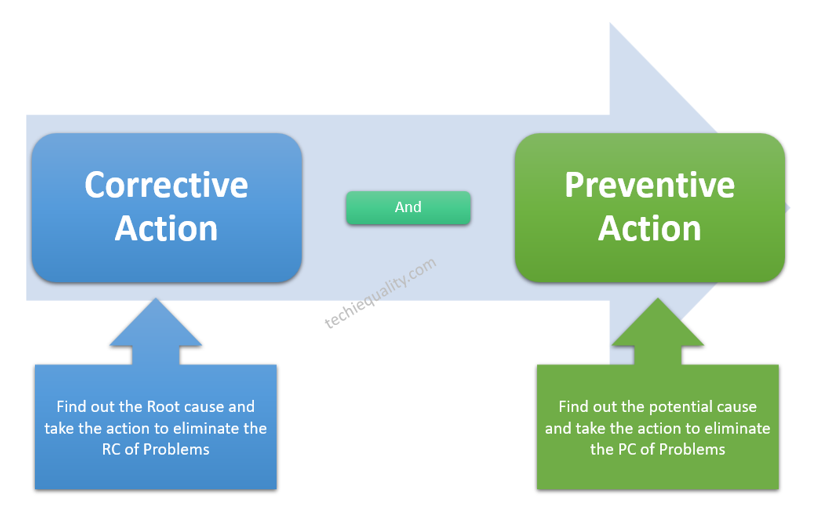
- Take the Action Plan (CAPA).
- Implement the action plan
- Monitor the effectiveness.
- Standardize the document
- Visualize the data, SOP, OPL, etc.
- Calculate the cost savings.
- Do the periodic Kaizen sustenance audit to know the actual status or function of Kaizen.
| Objectives | Helping tools/techniques/methods for kaizen | |
| Kaizen | To eliminate waste, optimize productivity, and achieve continuous improvement. | Engineering changes, Poka-yoke, SOP, OPL, PDCA, SDCA, Lean QC, QC, DMAIC, etc. |
For kaizen examples, let’s say a company has a manual process for line rejection identification in the product assembly line, The engineering team developed a Kaizen idean and installed an engineering poka-yoke system for automatic rejection identification in the assembly line. we have prepared the same in the kaizen report, which is given below;
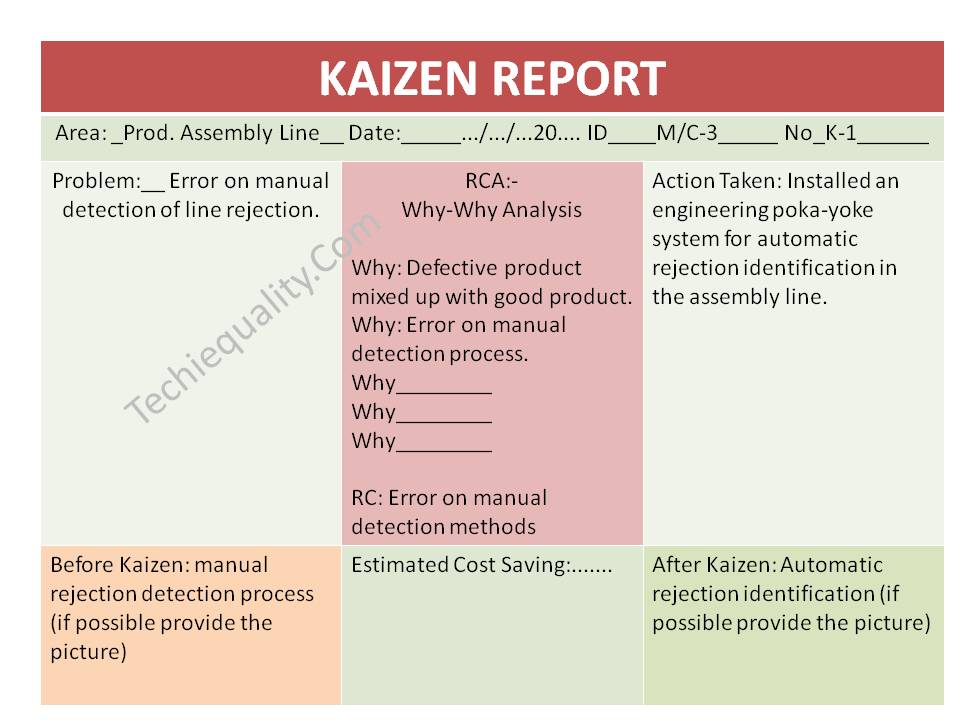
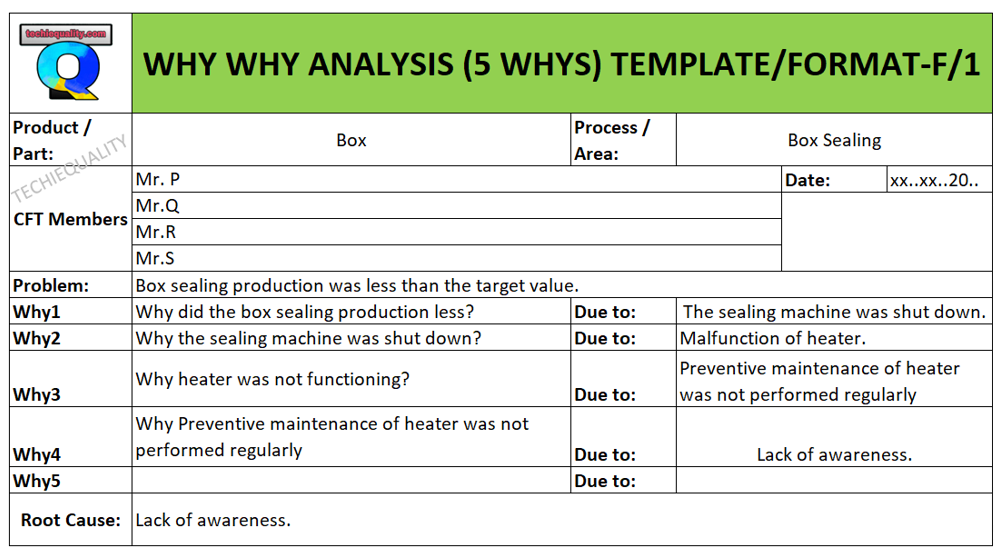
Kaizen Template:
Below kaizen template is very simple to understand and easy to implement. this kaizen sheet has very simple nomenclature, those are normally used in manufacturing industries. for a better understanding, you can refer to the above filled-up kaizen sheet/ report.
Kaizen Sustenance Checking Methods:
Implementation of kaizen is important but sustenance of the kaizen is very important, so you can follow the below steps to check the sustenance of kaizen.
- List out the monthly kaizen for your work zone.
- create a Team.
- Do at least half yearly kaizen sustenance audit
- If possible then, link the kaizen with the daily manufacturing operation check sheet.
- Incorporate the kaizen-poka yoke in the control plan and do the periodic test.
Thank you so much for visiting Techiequality.com
Popular Post:

Shanti Gopal Pradhan is an experienced professional in Quality Management Systems, QA, Operations, Business Excellence, and Process Improvement. He has strong expertise in international standards including IATF 16949, ISO 9001, ISO 14001, ISO 45001, and ISO 17025, along with methodologies such as TQM, TPM, and Six Sigma.
He holds a degree in Mechanical Engineering along with an MBA, combining strong technical acumen with strategic business insight, he is a Certified Internal Auditor, Lead Auditor, and Six Sigma Black Belt, with a proven track record in driving quality transformation and operational excellence.