SPC Format | DOWNLOAD Excel Template of SPC Study:
SPC Format is commonly used in the industry to know Process capability and how well the process Performs to meet the requirements. The SPC study consists of [1] Control Chart and [2] Process Capability. Here we will not discuss the statistical process control because we have already so many posts on our website “Techiequality.Com”. Links are mentioned at the bottom of this article. We have prepared simple Excel templates/ formats to keep in mind with the latest version of the SPC manual. And also we are offering here to our valuable readers to download the SPC format in Excel. These SPC charts, formats, and templates are given below, you are supposed to just click on the link to download the Excel file.
DOWNLOAD- Control Chart Excel Template/ Format.
Process Capability Study Excel Template/ Format-DOWNLOAD.
DOWNLOAD-Process Performance Study Excel Template/ Format.

Application Matrix of Statistical Process Control Study:
| SPC Study | Attribute Type Data | Variable Type Data |
| Control Chart | Yes | Yes |
| Cp & Cpk Study | Yes | |
| Pp & Ppk Study | Yes |
Types of SPC Study:-
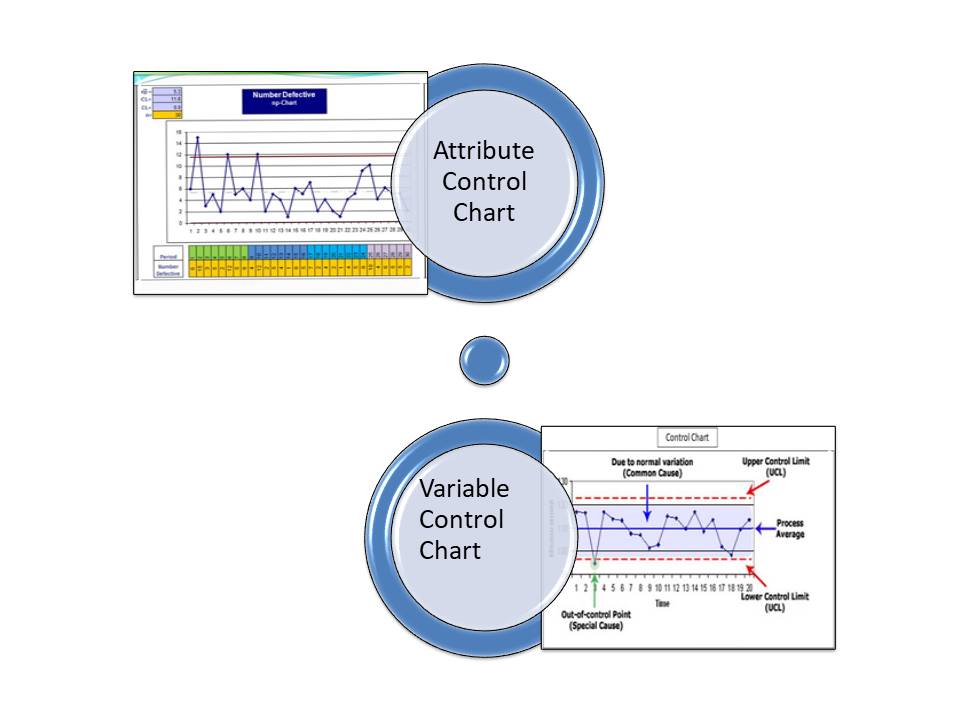
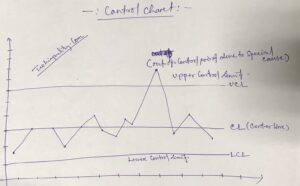
- Control Chart:
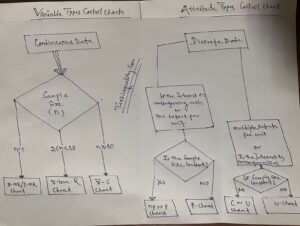
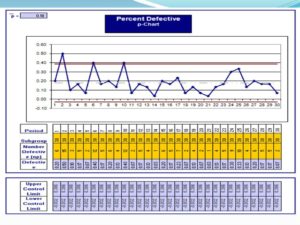
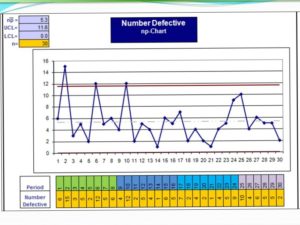
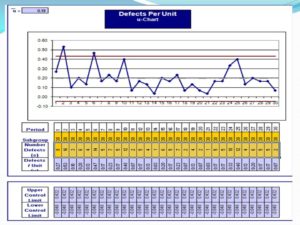
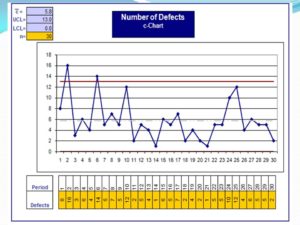
- Attribute type control chart:
- NP-Chart
- P-Chart
- U-Chart
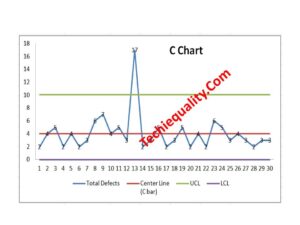
- C-Chart
- Variable type control chart:
- X-MR Chart
- X bar-R Chart
- X bar-S Chart
- Attribute type control chart:
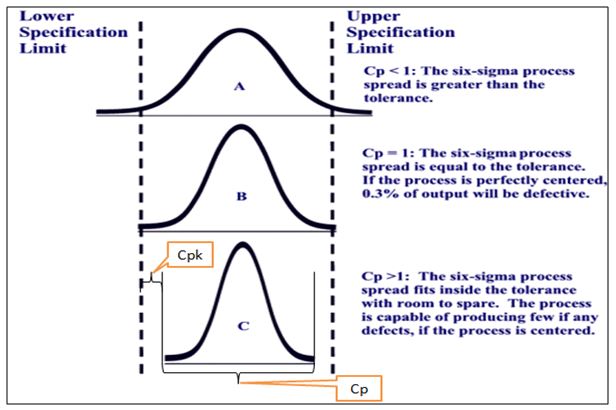
- Process capability:
- Process Performance:
Benefits of Statistical Process Control Study:
- Cost Control.
- Customer Satisfaction.
- Increase operational efficiency.
- Reduced Rejection, scrap, rework, and warranty claims.
- Reduces the need for inspection.
- Trigger when a problem occurs.
- Prevent unnecessary adjustment.
- Find out what the process can do.
- Provide immediate visual feedback.
- Less trouble at nest operation.
- Improved performance.
- Enable the process to perform consistently and predictably.
- Less downtime.
- Higher yields.
- Monitors process quality at the source.
FAQ:
How do I make an SPC chart in Excel?
We have already described the same in separate articles, if you would like to read and know the process, then you can read the below post.
QA/QC/TQM/Lean/6-Sigma Template or Format:


Similar Post:
The Techiequality.Com has been helping its readers with all extensions to enhance their skills with best industrial practices w.r.t QA, QC, Six Sigma concept, Lean design, lean manufacturing, business excellence, 5’S, etc. So mentioned some posts below that you would love to read…
7QC Tools Excel Template |DOWNLOAD Format.
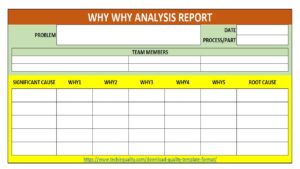
why why analysis methodology | 5-why analysis step by step guide.
Decision of process capability analysis |Download Format.
How to measure process capability (Cp & Cpk)? Download the Excel Template.
How to measure process performance (Pp & Ppk)?
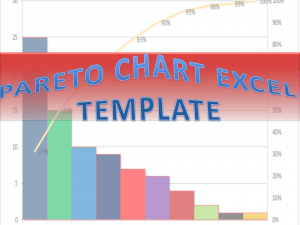
Pareto Chart Example of Manufacturing Units.
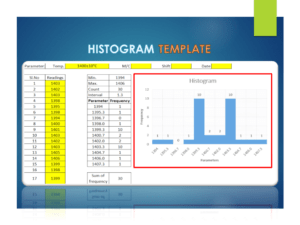
Histogram Example | Foundry Industries Examples.
More on TECHIEQUALITY


Thank you for reading…Keep visiting Techiequality.Com
I hope the above article is useful to you for your skill enhancement and deployment of SPC Tools in your organization…
Popular Post:

Shanti Gopal Pradhan is an experienced professional in Quality Management Systems, QA, Operations, Business Excellence, and Process Improvement. He has strong expertise in international standards including IATF 16949, ISO 9001, ISO 14001, ISO 45001, and ISO 17025, along with methodologies such as TQM, TPM, and Six Sigma.
He holds a degree in Mechanical Engineering along with an MBA, combining strong technical acumen with strategic business insight, he is a Certified Internal Auditor, Lead Auditor, and Six Sigma Black Belt, with a proven track record in driving quality transformation and operational excellence.