
Decision of process capability analysis:
Hello Readers! Today we will discuss here on Interpretation of Process capability Analysis’s Result. As you know Process Capability (Cp) is a statistical measurement of a process’s ability to produce parts within specified limits on a consistent basis and it gives us the idea about the width of the Bell curve. And similarly, the Process capability index (Cpk) gives the idea as [1] how closely a process is able to produce the output to its overall specifications. [2] More Value of Cpk means more process capable. [3] Cpk value <1 means the bell curve will out of USL/LSL. This article is all about the decision of process capability analysis means how to take a decision after measuring /calculating the Cp & Cpk value. For your better understanding, we have mentioned the other topics, first of all, go through these articles and download the Excel template /format as well.
Download the Process Capability Excel Template.
Decision of process capability analysis:
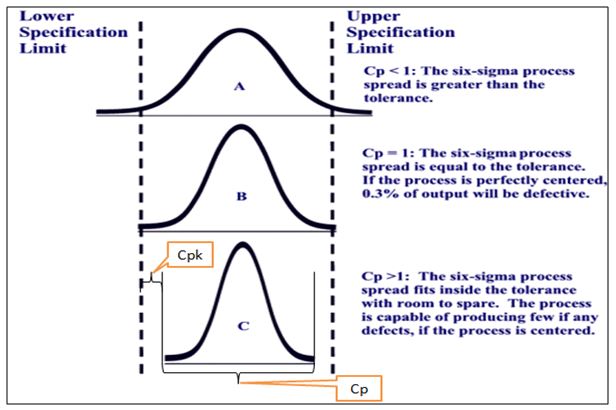
As you can see in the above figure, we have considered the three conditions as Cp=1, Cp>1, and Cp<1. The value Cp is generally gives an idea about the width of the bell curve. It means sample spread width. We will see in the graph whether the width of the bell curve is within the specification limit or not. And also we shall give attention to Cpk and Cp value. The complete decision of the above figure is given and if simultaneously, you would like to read our similar types of posts then, you can read the given below articles/topics/posts.
How to measure process capability (Cp & Cpk)? Download Excel Template?
How to measure process performance (Pp & Ppk)?
Process Performance Example (Pp) & Ppk |Download Format
How to calculate process performance (Pp & Ppk)?
Decision:
- If the width of Bell Curve is within the specification limit means, sample parameters are within the specification. Less symmetric width w.r.t mean value indicate more control in process.
- If width of the curve is out of specification limit [see the above figure, condition Cp<1] it indicate that some of the sample parameters are out of specification (USL/LSL).
- Best Industry Practices and as per CSR, the start-up value of Cpk is 1.33 and More Value of Cpk means more process capable.
How to start calculating Cp and Cpk value of manufacturing process parameters?
If the manufacturing process is stable or controlled, then start recording the variable type data after selecting the subgroup type.
Calculate the standard deviation value.
and finally, apply the formula of Cp and Cpk to calculate the value.
Note: We have already mentioned the Articles in this post for manual calculation and by using Minitab. Just read these articles.
Read Similar Post:
Process Performance (Pp) & Ppk Excel Template |DOWNLOAD
Jidoka Autonomation, Bakayoke & Yo-I-don |Concept in TPS
Histogram Template with example | Download
How to do Capability Analysis by Minitab 18? | Minitab Process Capability Tutorial
Thank you for reading …Keep visiting Techiequality.Com
I hope the above Article/ post “Decision of process capability analysis” is useful to you….
Popular Post:

Shanti Gopal Pradhan is an experienced professional in Quality Management Systems, QA, Operations, Business Excellence, and Process Improvement. He has strong expertise in international standards including IATF 16949, ISO 9001, ISO 14001, ISO 45001, and ISO 17025, along with methodologies such as TQM, TPM, and Six Sigma.
He holds a degree in Mechanical Engineering along with an MBA, combining strong technical acumen with strategic business insight, he is a Certified Internal Auditor, Lead Auditor, and Six Sigma Black Belt, with a proven track record in driving quality transformation and operational excellence.