DMAIC Tools | DMAIC Template | Six Sigma Methodologies | 20+ Free Tools
Hello readers! Today we are going to discuss an important topic on various DMAIC tools, Six Sigma methodologies, and the DMAIC template and its usage. Six Sigma is a very popular methodology that has been using in manufacturing industries for continuous improvement. A set of methodologies and various tools are used to improve the processes by optimizing efficiency, eliminating waste, reducing defects, minimizing variation, reducing errors, and increasing quality, etc. The main objectives of Six Sigma projects are to enhance the Sigma level and to reduce or minimize the DPMO (Defects per million opportunities).
What are the Six Sigma Belt Levels?
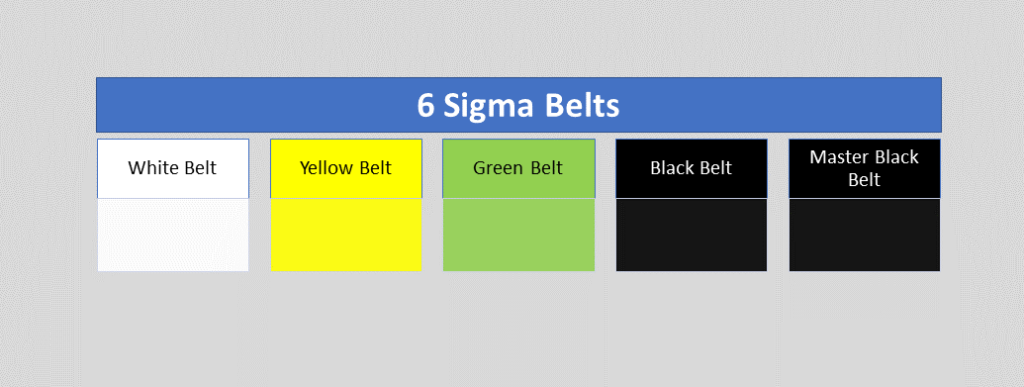
As we know that there are various belts in Six Sigma certifications, for example, master black belts, black belts, green belts, yellow belts, white belts, etc. Let’s understand the details of all belts;
White Belt:
This is the first level of six sigma certification. During white belt certification, you can learn the overview of the entire six sigma course. This six sigma course mainly emphasizes the basic concept of six sigma, fundamental methodology, terminology, etc. the course time periods may depend on the course providers once you are certified in the course you can easily understand the basic of Six Sigma and can work as problem-solving team that supports the overall projects teams. Many times people are confused about choosing the six sigma certification belt level. But I hope after reading all the Six Sigma belt levels, you can easily choose the course for yourself.
Yellow Belt:
Don’t confuse yourself when hearing about different types of belts. Different types of belts are classified according to the different levels of course like basic to advanced, roles of the certificate holder, level of project, knowledge level, etc. so according to your understanding of Six Sigma you can choose the certification course. The yellow belt is the second level of the certification course. The yellow belt certificate holder can participate as a project team member. And can review the process improvement that supports the project and review the six sigma process. However, the yellow belt is not adequate to empower certificate holders to lead a six sigma project.
Green Belt:
Through the Green Belt, a GB-certified holder may have with proper knowledge and understanding of Six Sigma methodology, application of tools, etc. As a GB certified holder, you can lead the GB Six Sigma project or teams. In the GB project, you can take part as a team leader or member of the GB six sigma project with strategy implementation, methodology application, problem-solving, decision-making, etc. You can help with the black belt project for data collection and analysis.
Black Belt:
The black belt certified holder’s primary roles are process improvement, variation reduction, quality enhancement, DPMO reduction, and Sigma level enhancement by applying the six sigma methodology and concept. This is the advanced level, of course, compared to the green belt. BB certificate holder leads the project, trains and coaches the project teams as well.
Master Black Belt:
MBB is the high point of the six sigma course. A master black belt certificate holder trains and coaches the black belt and green belt holder. Your role is to make a six sigma strategy and implement an advanced level. Act as a six sigma technologist and give the strategic direction to the next level in your organization. You play a vital role as an expert in providing leadership, facilitation, methodology application, and strategic direction.
Now, we will discuss on some common numerical terminology of Six Sigma which is frequently used in projects like DPU, DPO, DPMO, DPPM, Cp, Cpk, RPN, PN, Gauge R&R, Sigma level, P value, etc. sigma level you can choose from the sigma level table w.r.t DPMO value or you can calculate the value on excel as well.
DPMO, DPU, DPO, DPPM:
DPMO (Defects per million opportunities):
Before starting the DPMO calculation and concept, we will be understanding what is defects and defective items with the manufacturing practical example. Let’s consider a process control inspector doing the inspection in the production line and he booked some non-conforming items. He has recorded 5 non-conforming items and rejected those due to finding the following defects in items
| Items | Defects |
| Item-1 | Defect-1, defect-2, defect-3 |
| Item-2 | defect-3 |
| Item-3 | defect-2, defect-3 |
| Item-4 | Defect-1, defect-2 |
| Item-5 | Defect-4 |
Now, you can see in the above table we have recorded the 5 items and their defects. Every 5 items have a defect, so all 5 items are defective items or non-conforming items. If you look closely at the above table then you can find one thing that each item has one or more than one defect in a single unit. So, for example, item-1 is a defective product and having 3 defects. I hope the concept of defective vs defects is now understood. So, let’s arrange the above data table for easy understanding.
| Items | Defect-1 | Defect-2 | Defect-3 | Defect-4 |
| Item-1 | x | x | x | |
| Item-2 | x | |||
| Item-3 | x | x | ||
| Item-4 | x | x | ||
| Item-5 | x | |||
| Total Defects = | 2 | 3 | 3 | 1 |
The total defects of the 5 items are 9. (2+3+3+1). And the total number of defective items is 5.
Now we will calculate the value of DPU, DPO, DPMO, and DPPM.
In the above table, we found the following data as;
| Total Defects = 9 |
| Total Defective unit = 5 |
| Defects opportunity per unit = 4 |
| Total Units (for example) = 100 nos. |
| Total defects opportunities = 400 (4 x 100) |
DPU (Defects per unit):
DPU Formula = Total number of Defects / Total units
DPU Calculation: DPU = 9/100 = 0.09
Defects Per Opportunity- DPO:
DPO Formula = Total number of defects/ (number of units x defects opportunity per unit)
= Total number of defects/ Total defects opportunities
= 9/ 400 = 0.0225 = 0.023
(Defects per million opportunities) DPMO:
DPMO Formula =
{Total number of defects/ (number of units x defects opportunity per unit)} x 1000000
= (Total number of defects/ Total defects opportunities) x 1000000
DPMO Calculation:
= (9/400) x 1000000
= 22500
(Defective Parts Per Million) DPPM:
DPPM Formula = (Total Defective parts / Total parts) x 1000000
DPPM calculation: (5 / 100) x 1000000
= 50000
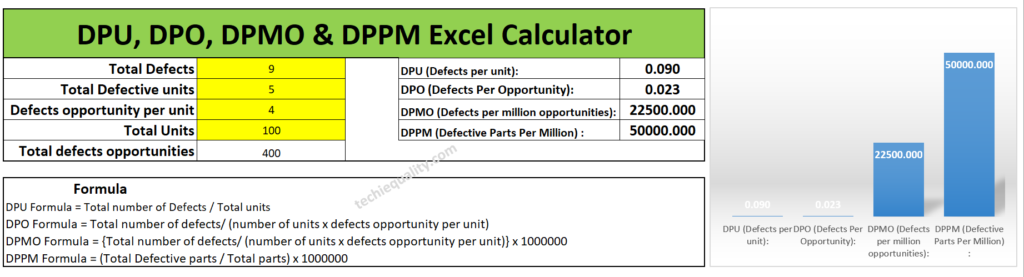
According to the above data set the DPU, DPO, DPMO, and DPPM calculated values are given below table.
Date Set:
| Total Defects = 9 |
| Total Defective unit = 5 |
| Defects opportunity per unit = 4 |
| Total Units (for example) = 100 nos. |
| Total defects opportunities = 400 (4 x 100) |
Values:
| DPU (Defects per unit): 0.09 |
| DPO (Defects Per Opportunity): 0.023 |
| DPMO (Defects per million opportunities):22500 |
| DPPM (Defective Parts Per Million) : 50000 |
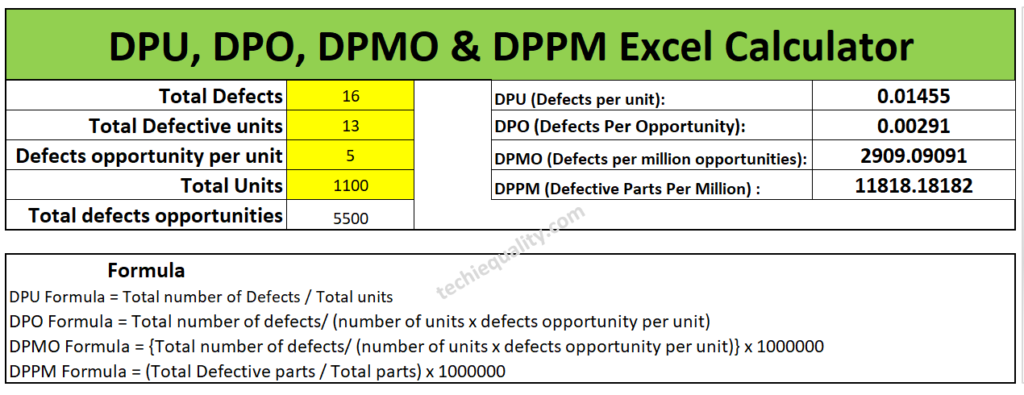
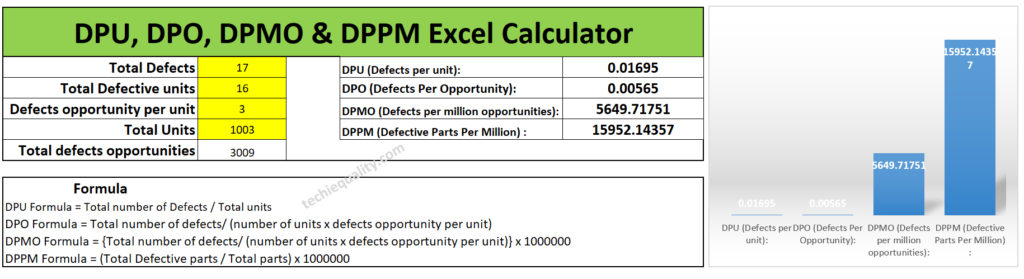
Excel calculator:
If you are interested to download the Excel DPMO calculator and DPPM calculator then download them from the below link.
Download Excel DPMO & DPPM Calculator
How to use Excel DPMO & DPPM Calculator?
It’s very simple to use our excel template just download the excel calculator and then follow the below steps.
Step-1: Download the excel DPMO and DPPM calculator from the above given link.
Step-2: Enter the value only on the yellow highlighted box.
Step-3: The DPU, DPO, DPMO, and DPPM values will be calculated automatically.
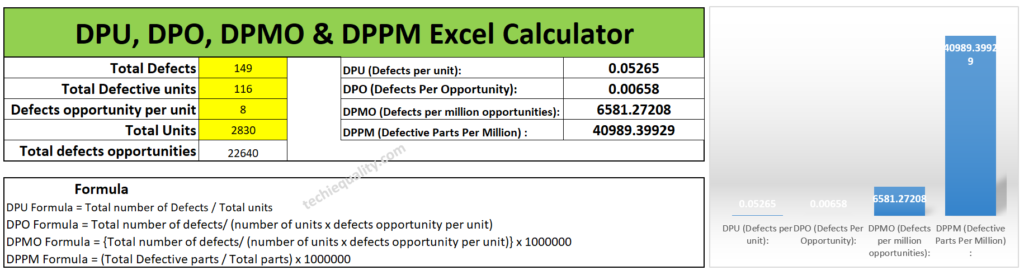
Manufacturing Example:
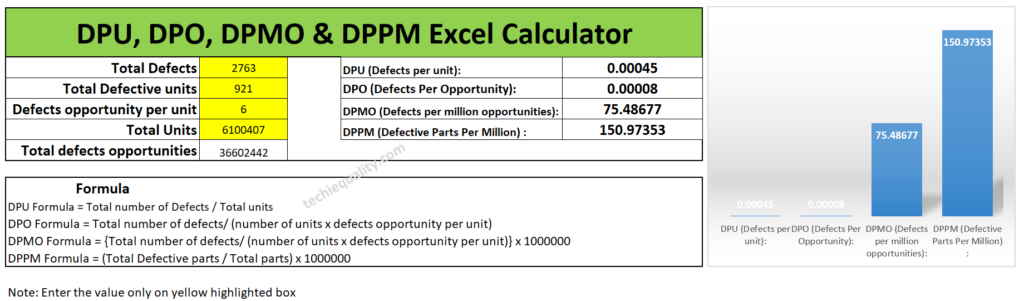
Let’s consider a company manufacturing automobile parts. And they are producing x nos of parts on a monthly basis but facing a huge rejection in the production line at the blanking and piercing operation process. so, it has been decided in the quality meetings for improvement projects to reduce the rejection% and improve the variation. So, for the improvement project, the Line QA engineer collected the following data for the calculation of DPU, DPO, DPMO, and DPPM for project input. Data are given in below table;
| Total Defects = 2763 |
| Total Defective unit = 921 |
| Defects opportunity per unit = 6 |
| Total parts produced = 6100407 |
| Total defects opportunities = 3,66,02,442 (6100407 x 6) |
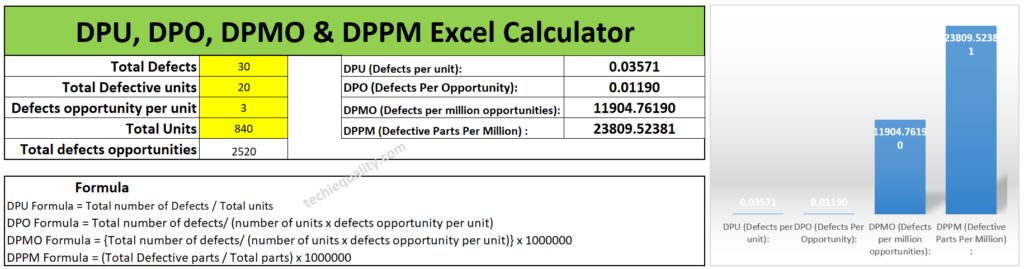
Without wasting my time, I’m going to calculate the value by using the above excel template. And the calculated value is given below.
I would request to all my readers, who are currently reading this article try to calculate the DPMO and DPPM values manually by apply the above formula and match with the excel calculator value.
Regarding the process capability calculation we have already uploaded the article you can read our article on How to measure process capability (Cp & Cpk)? Download Excel Template.
Process Capability Analysis |Cp & Cpk Calculation Excel Sheet with Example
Defectives vs Defects:
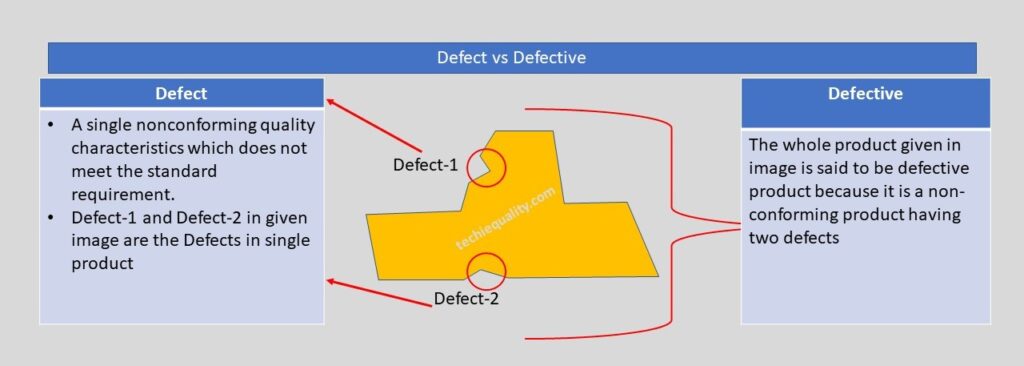
Let us understand the difference between Defect and Defective with the help of the above example. As you can see in the above image one product having two nonconforming quality characteristics which do not meet the standard or customer requirement, which is called a defect, and the whole product is called a defective product because having two defects. If you would like to know the total defective product and total defects in the above example, then we can easily say that the total defective product is 1 and the total defects are 2. Now I hope you understand the difference between defective and defects.
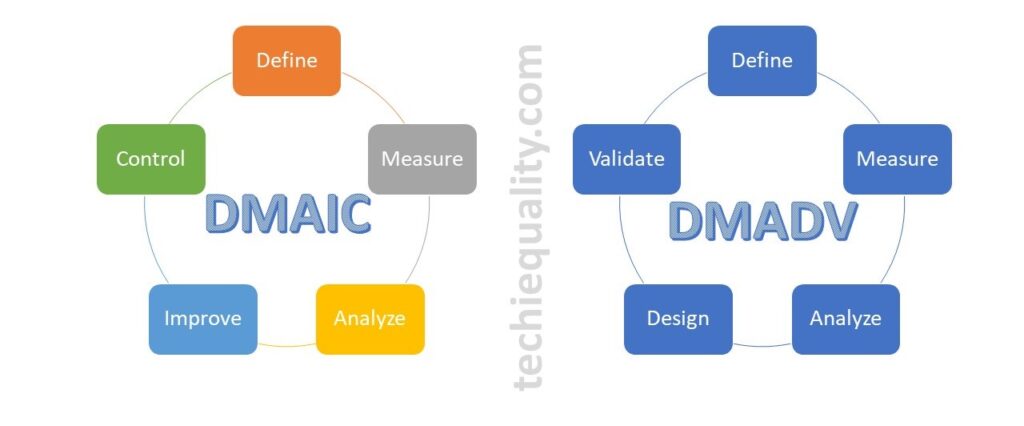
Six Sigma Methodologies:
There are many methodologies used in six sigma projects but the popular methodology is DMAIC (Define, Measure, Analyze, Improve and Control). Similarly, in the design of the Six Sigma project, the popular methodology is used as DMADV (Define, Measure, Analyze, Design, and Validate). However in Lean Six Sigma, both lean tools and DMAIC methodology are used.
DMAIC Tools & DMAIC Template
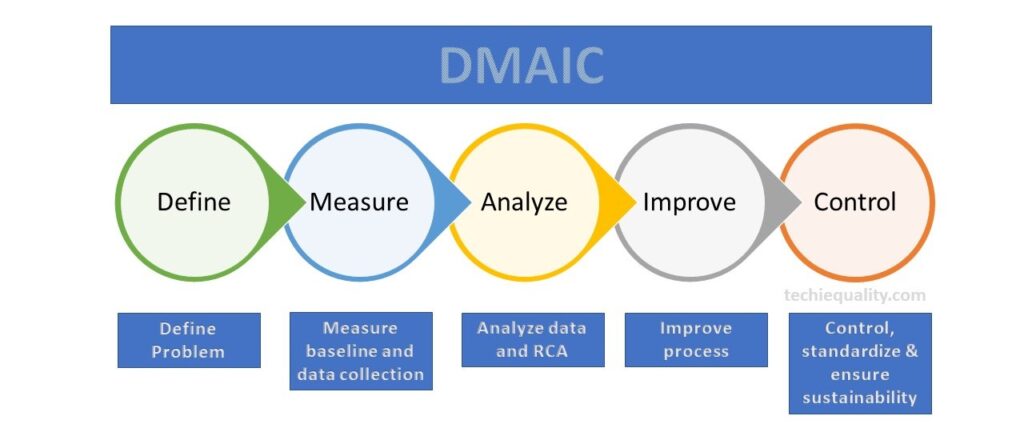
DMAIC methodology is a very popular mythology that is used in six sigma projects. The DMAIC methodology consists of 5 phases i.e. Define Phase, Measure Phase, analyze Phase, Improve Phase, and Control Phase. We have already published common and popular DMAIC tools, DMAIC templates, and formats. But following DMAIC tools are listed below;
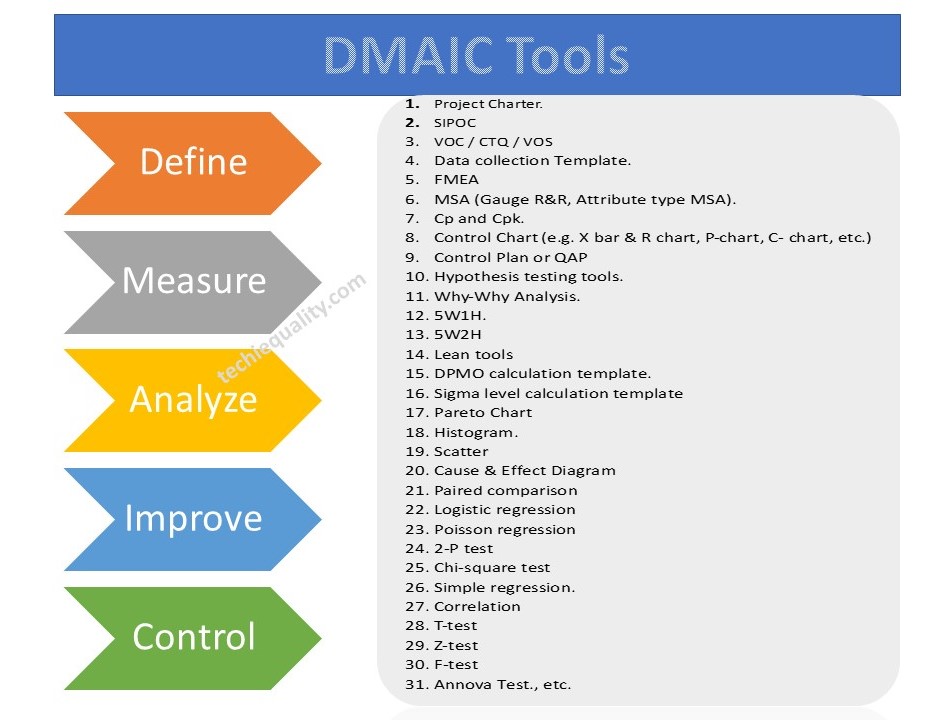
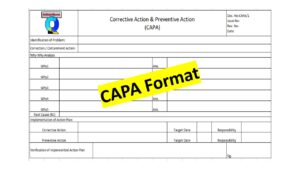
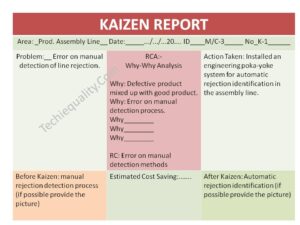
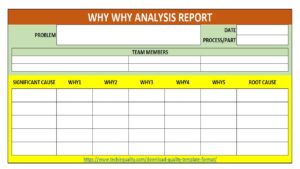
DMAIC Tools, Template, and Format:
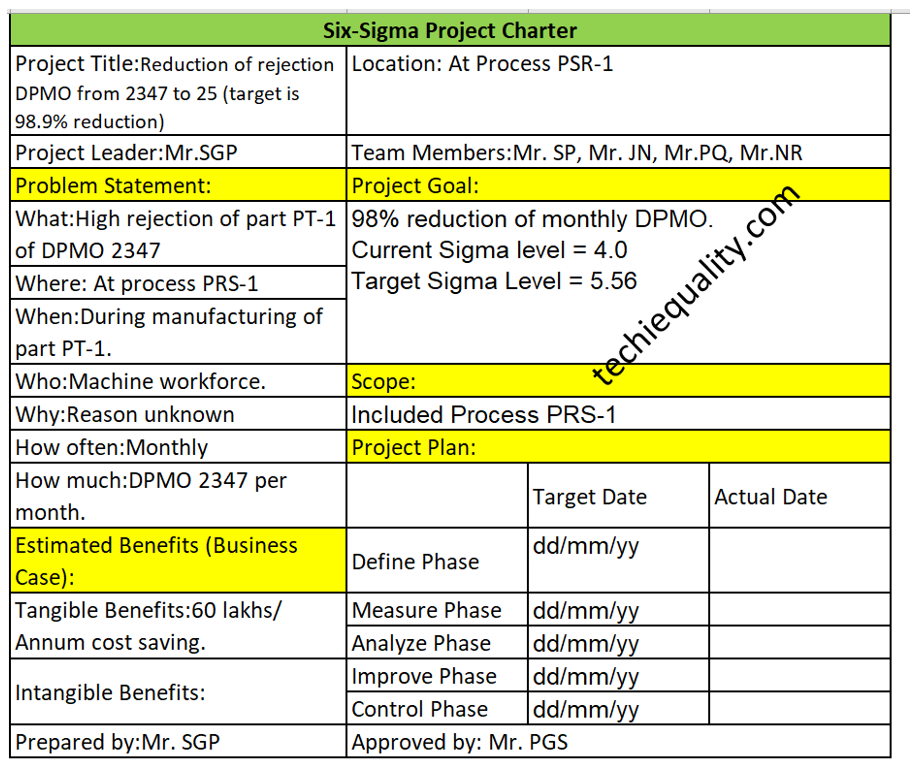
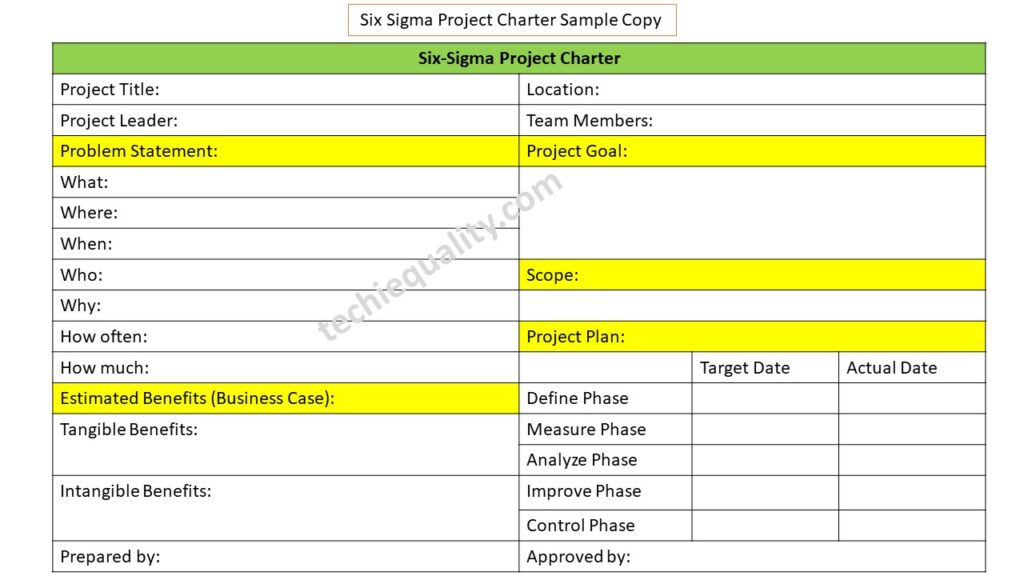
- Project Charter.
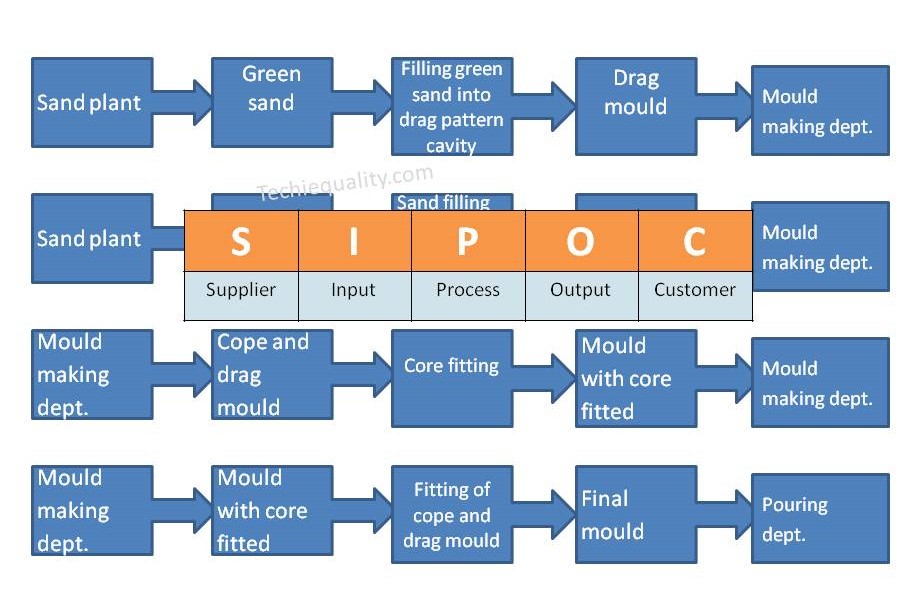
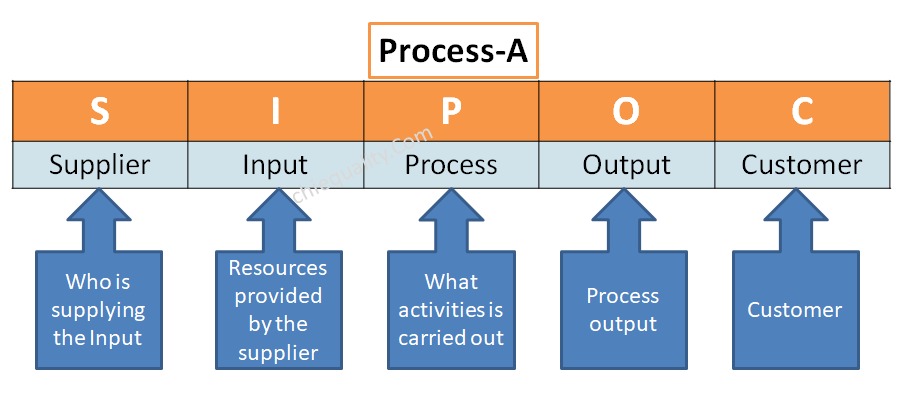
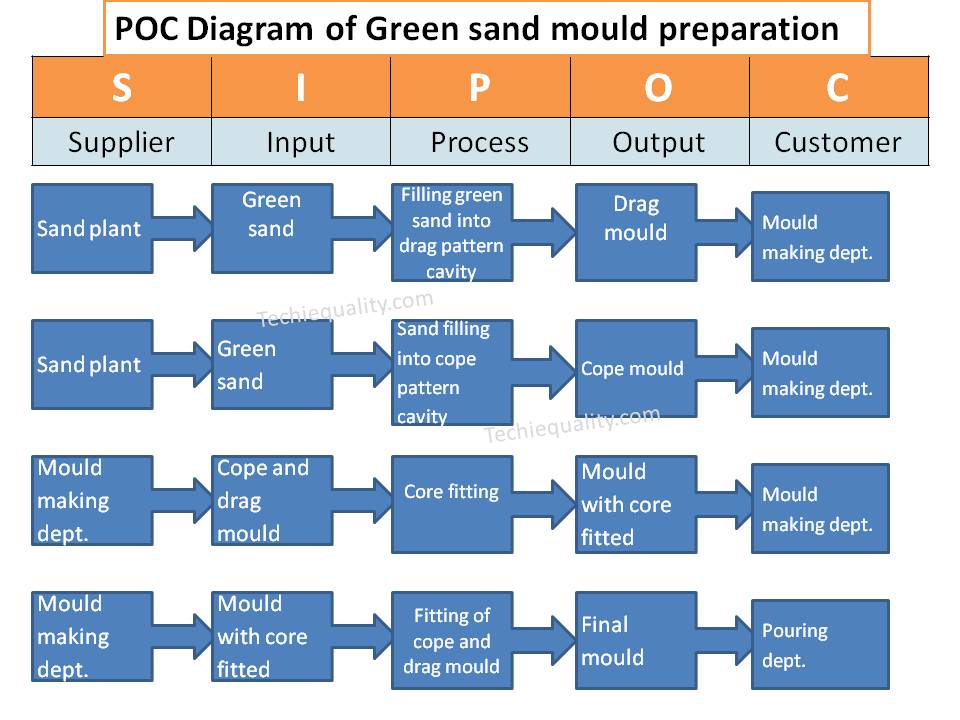
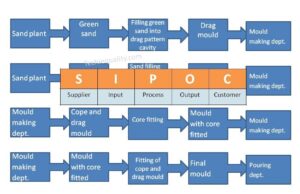
- SIPOC
- VOC / CTQ / VOS
- Data Collection Template.
- FMEA
- MSA (Gauge R&R, Attribute type MSA).
- Cp and Cpk.
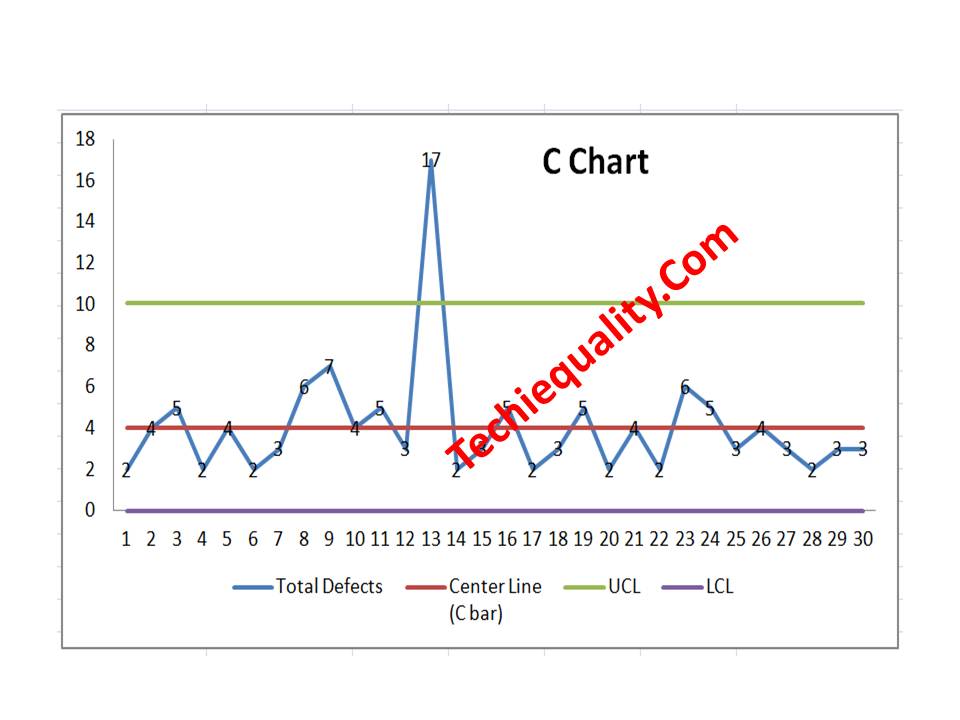
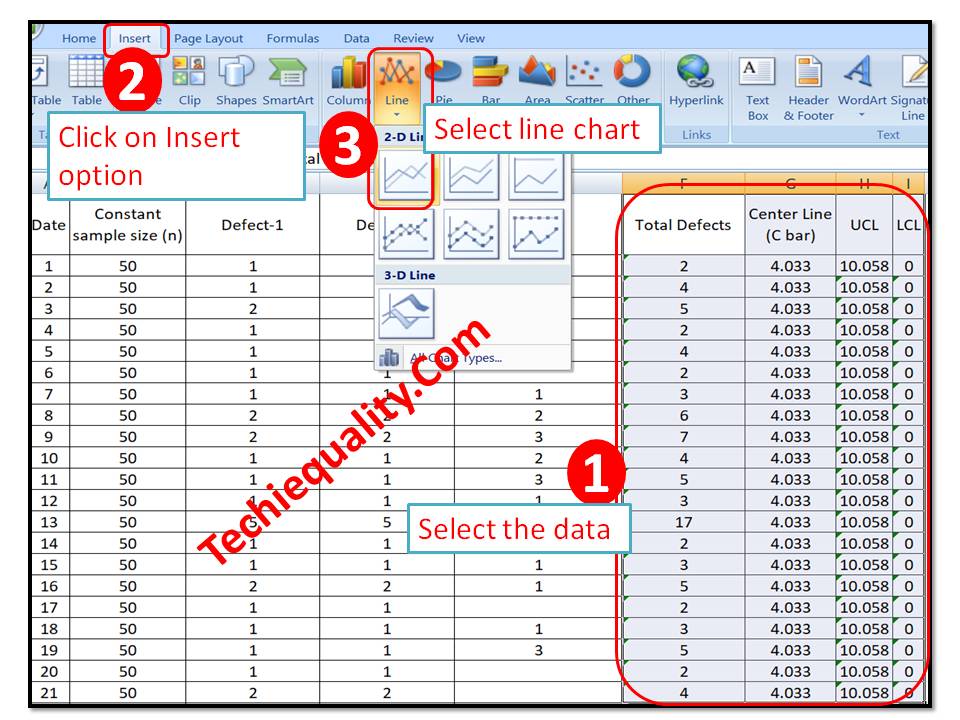
- Control Chart (e.g. X bar & R chart, P-chart, C- chart, etc.)
- Control Plan or QAP
- Hypothesis testing tools.
- Why-Why Analysis.
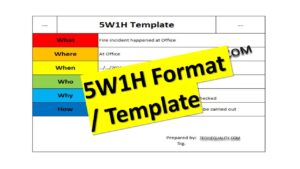
- 5W1H.
- 5W2H
- Lean tools
- DPMO calculation template.
- Sigma-level calculation template
- Pareto Chart
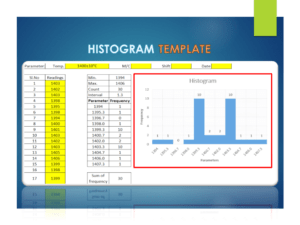
- Histogram.
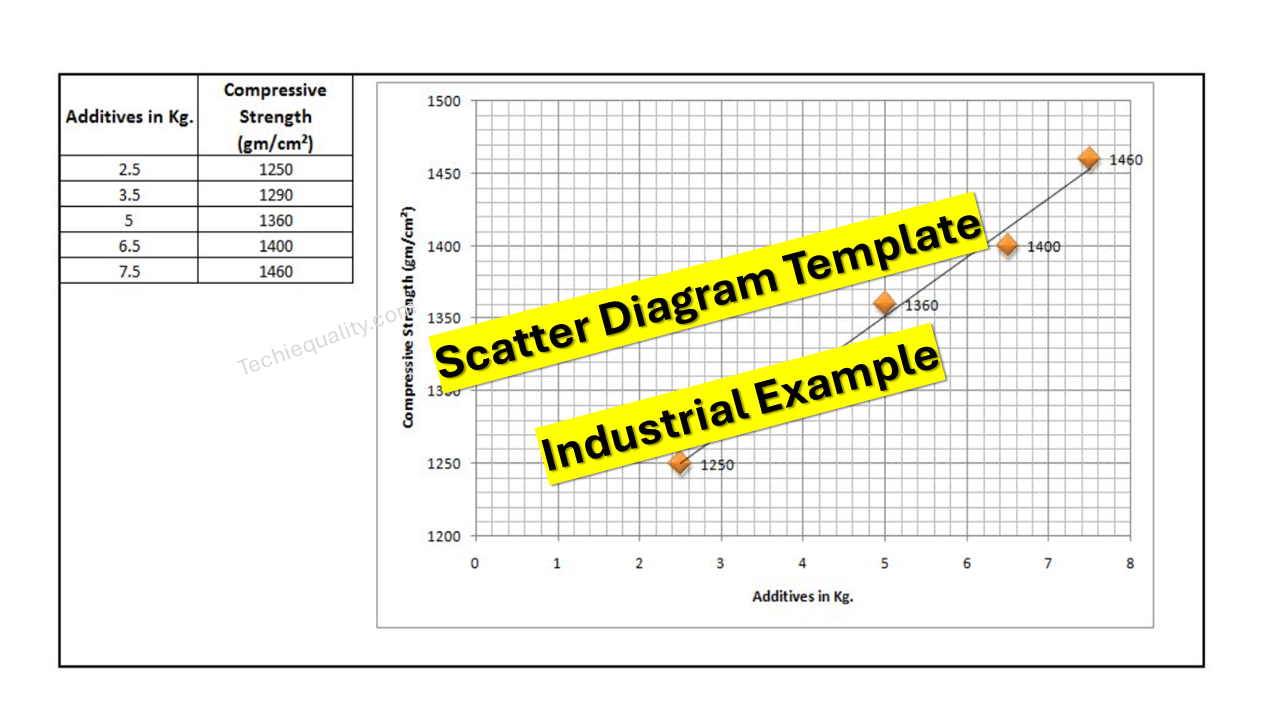
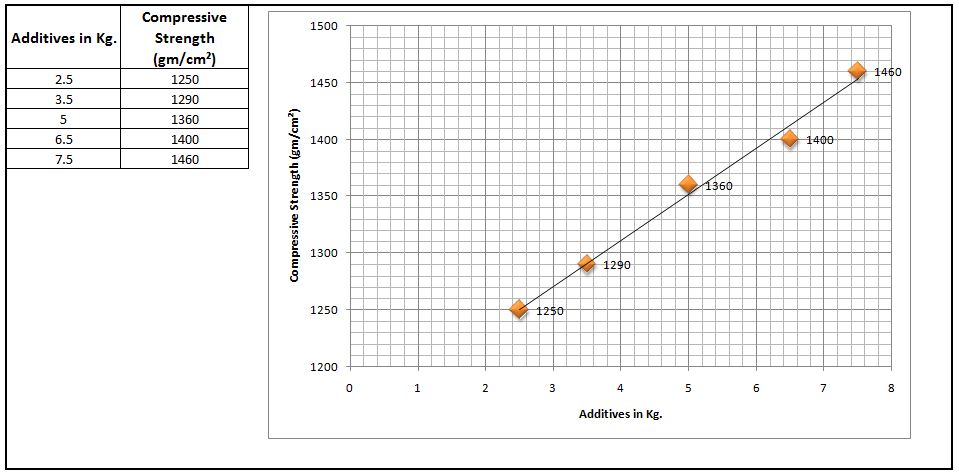
- Scatter
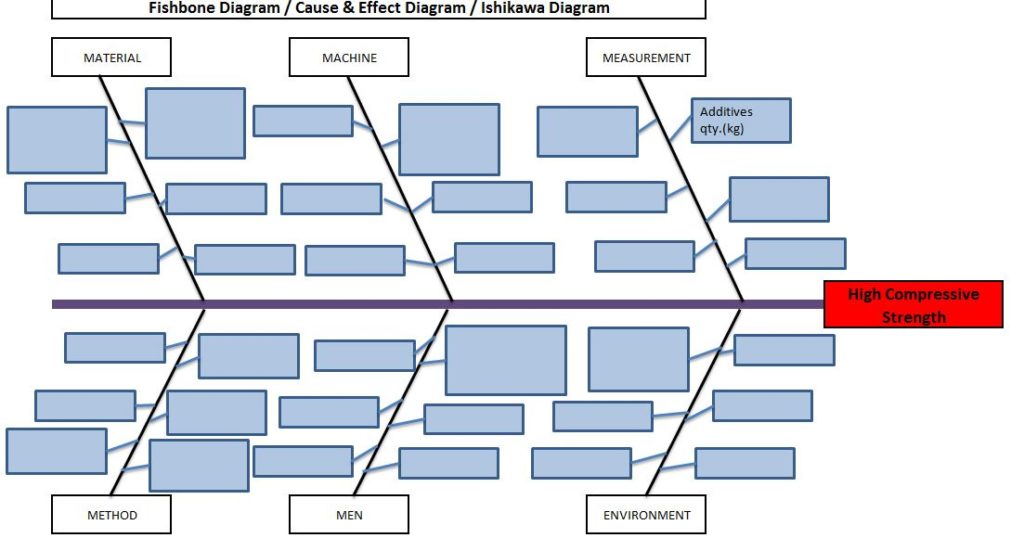
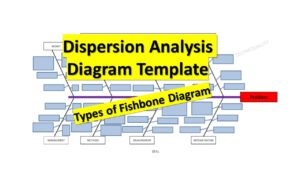
- Cause & Effect Diagram
- Paired comparison
- Logistic regression
- Poisson regression
- 2-P test
- Chi-square test
- Simple regression.
- Correlation
- T-test
- Z-test
- F-test
- Annova Test., etc.
If you would like to download the free templates and formats then click on DOWNLOAD Free Templates.
QA/QC/TQM/Lean/Six Sigma Templates or Format:


More on Techiequality


Shanti Gopal Pradhan is an experienced professional in Quality Management Systems, QA, Operations, Business Excellence, and Process Improvement. He has strong expertise in international standards including IATF 16949, ISO 9001, ISO 14001, ISO 45001, and ISO 17025, along with methodologies such as TQM, TPM, and Six Sigma.
He holds a degree in Mechanical Engineering along with an MBA, combining strong technical acumen with strategic business insight, he is a Certified Internal Auditor, Lead Auditor, and Six Sigma Black Belt, with a proven track record in driving quality transformation and operational excellence.