Fishbone Diagram Template With Example
Fishbone Diagram Template With Example | Download Template
Download the Fishbone Diagram Template by clicking on the below link. Fishbone Diagram will help you to represent the Potential Causes of a Problem.
DOWNLOAD the Cause & Effect Diagram / Fishbone Diagram.
How to Use Fishbone Diagram Template:
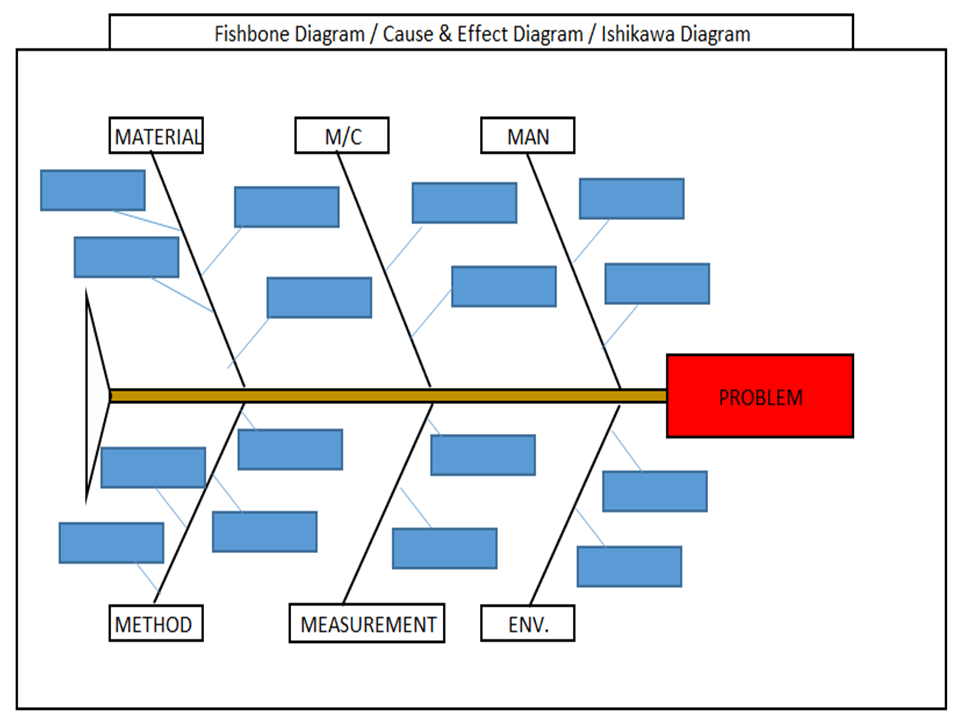
[Figure-1]
Step-1: Download the Fishbone Diagram Template (Link is given at the top)
Step-2: Enter the Name of the Problem in the Red Highlighted Box, marked in the Excel template (e.g. refer to the above Figure-1 for easy understanding)
Step-3: Identify and then enter the Potential causes in the Sky color box in the Excel template under Man, Machines, Material, Method, Measurement, and Environment.
How to Identify the Potential Causes of a Problem:
Step-1: To make a CFT Team (Cross-Functional team). Members of CFT should be from different and different processes/areas or departments. E.g. someone from production, Quality, technical, R&D, Maintenance, etc.
Step-2: Individually identify the Causes through Brainstorming.
Step-3: Before you identify the causes by all team members, you have to list up all causes without any repetition. Next, all members of the team should sit together to identify the new causes through Brainstorming. And finally, do the list up of all causes identify by individual and team.
Step-4: Represent all potential causes in the Cause and Effect Diagram Template or Fishbone Diagram Template or Ishikawa Diagram Template.
Step-5: Identify the Significant Causes with the help of Hypothesis testing.
Step-6: Do the Root cause analysis with the help of Why- why Analysis to identify the Root Cause
Step-7: Take Corrective and Preventive Action on the Root cause.
Example-1: Casting Shrinkage Problem.
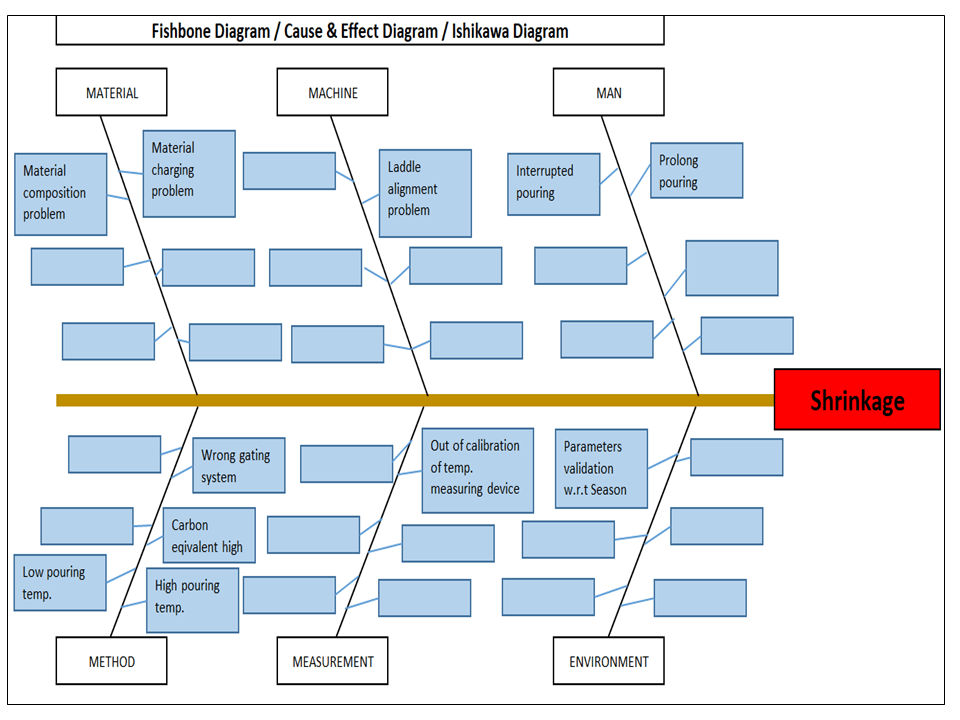
I have taken a Problem from the Iron casting Process as Shrinkage. Here I need to represent the Potential causes of Shrinkage in the Fishbone Diagram Template or Cause and Effect Diagram Template or the Ishikawa Diagram template. First of all, I made a CFT team considering the members from the production process, quality, Development,
Instructed all members to identify the Potential cause relevant to their work function in individually through Brainstorming. Next, collect all Potential causes. And then call a meeting for further identification of Causes together with all members through Brainstorming. List up all Causes and represent those in the Fishbone Diagram Template, just like the below figure.
Example-2: Casting Blow-hole Problem:
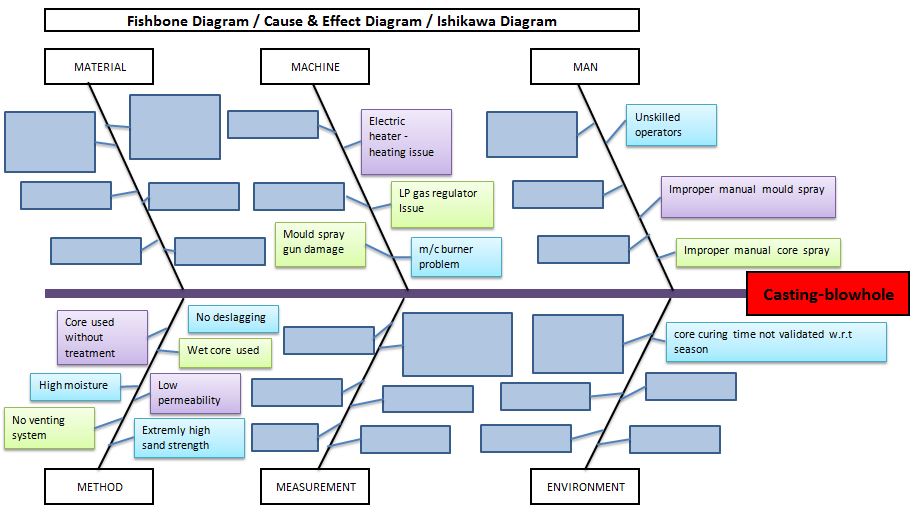
Below are the potential causes that may cause the blow-hole problem in raw casting products;
- Improper manual core spray.
- Improper manual mould spray.
- Unskilled operators.
- Core curing time is not validated w.r.t season.
- Core curing m/c burner problem.
- LP gas regulator issue.
- Electric heater -heating issue.
- Mould spray gun damage.
- No deslagging.
- Wet core used.
- Low permeability.
- Extremely high sand strength.
- No venting system.
- High moisture.
- Core used without treatment.
Benefits of Fishbone Diagram:
- It represents and displays the relationship of potential causes w.r.t Problem: – All Possible causes will represent them under which category among the man, machines, method, measurement, material, and environment.
- Accumulate the possible Reasons in a single diagram: – It will be very difficult to resolve the problem without any idea of the Possible or Potential causes of any problem. So this diagram will show you all the causes simultaneously.
- Involvement in Brainstorming: – It will help you to boost and structure the brainstorming to identify the possible causes or reasons.
- It will help you to maintain the team focus to achieve the common goal: – As you know the team mission is to achieve the common goal means to identify the possible causes or reasons. All team members will identify the Causes or Reasons individually and together in a
team to list-up the possible causes.
How to plot Ishikawa or cause and effect diagram of customer complaint:
first of all, download the cause and effect diagram template or Ishikawa diagram template from the given above link (at the top) and then follow the below steps. As per my own experience regarding the preparation of cause and effect diagrams related to customer complaints. at first, when I received a customer complaint, I just tried to understand the nature and type of problem and immediately called for a meeting for initial problem understanding with team members. Once it’s understood by all the team members, then we form a special team for 8D or CAPA formation.
Before doing the why-why analysis we have to identify the potential causes by using popular tools i.e. fishbone or cause & effect or Ishikawa diagram. To do so, the individual team members should identify the potential cause w.r.t customer complaints, Once you collect the all identified potential causes by individual members, then you have to plot the final fishbone diagram to keep in your mind with the repeated potential causes. when you choose to form the team at that time members should be in CFT of that process where the customer problem is related.
More on TECHIEQUALITY
