Process Performance Excel Template (Pp & Ppk Format) | DOWNLOAD
Process Performance Excel Template: According to the SPC (Statistical Process Control Manual), the process Performance (Pp) compares the process performance of the process to the maximum allowable variation as indicated by the tolerance. The Pp (Process Performance) provides a measure of how well the process will satisfy the variability requirements. And the Index of process performance is termed as Ppk. It takes the process location as well as the performance into account. Download the Excel Template /Format of Pp & Ppk from the below link.
DOWNLOAD Excel Template/Format of Pp & Ppk calculation with Example.

How to use the Pp & Ppk Excel Format in your process to calculate the index value?
1: Download the Template/ Format from the above links.
2: Read the note mentioned in the Excel template.
3: Only the yellow colour box (mentioned in format) is changeable and other values will calculate automatically.
The formula of Pp (Process Performance):
Pp = ((USL-LSL)/ (6 X S))
[Where USL=Upper specification limit, LSL=Lower specification limit and S= Standard Deviation]
The formula of Ppk (Process Performance Index):
Ppk = Minimum of PPU or PPL
PPU= ((USL-Average of average)/ (3 X S))
PPL= ((Average of average-LSL)/ (3 X S))
Note: Pp ≥ Ppk.
Example:
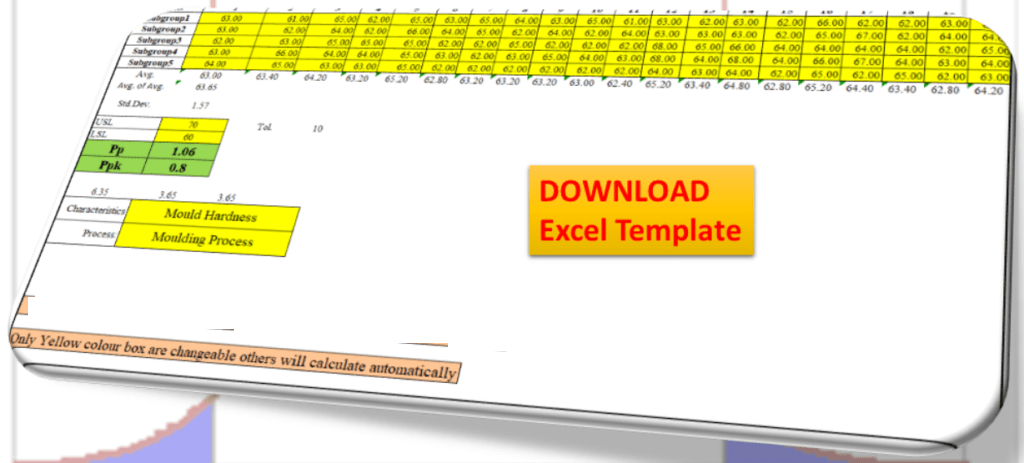
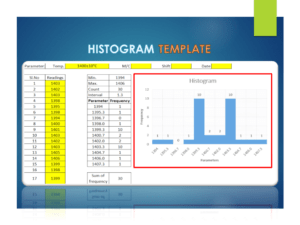
Company XYZ pvt ltd is interested to know the process performance of moulding process that, how well the process is performing and satisfies the variability requirements of mould hardness. The process engineer has collected the total 100 numbers of readings considering with subgroup size 5. Readings are given below;
| Sl.No. | 1 | 2 | 3 | 4 | 5 | 6 | 7 | 8 | 9 | 10 |
| Subgroup1 | 63.00 | 61.00 | 65.00 | 62.00 | 65.00 | 63.00 | 65.00 | 64.00 | 63.00 | 65.00 |
| Subgroup2 | 63.00 | 62.00 | 64.00 | 62.00 | 66.00 | 64.00 | 65.00 | 62.00 | 64.00 | 62.00 |
| Subgroup3 | 62.00 | 63.00 | 65.00 | 65.00 | 65.00 | 62.00 | 62.00 | 65.00 | 62.00 | 62.00 |
| Subgroup4 | 63.00 | 66.00 | 64.00 | 64.00 | 65.00 | 63.00 | 62.00 | 63.00 | 65.00 | 64.00 |
| Subgroup5 | 64.00 | 65.00 | 63.00 | 63.00 | 65.00 | 62.00 | 62.00 | 62.00 | 62.00 | 62.00 |
| 11 | 12 | 13 | 14 | 15 | 16 | 17 | 18 | 19 | 20 |
| 61.00 | 63.00 | 62.00 | 63.00 | 62.00 | 66.00 | 62.00 | 62.00 | 63.00 | 65.00 |
| 64.00 | 63.00 | 63.00 | 63.00 | 62.00 | 65.00 | 67.00 | 62.00 | 64.00 | 64.00 |
| 62.00 | 68.00 | 65.00 | 66.00 | 64.00 | 64.00 | 64.00 | 64.00 | 62.00 | 65.00 |
| 63.00 | 68.00 | 64.00 | 68.00 | 64.00 | 66.00 | 67.00 | 64.00 | 63.00 | 64.00 |
| 62.00 | 64.00 | 63.00 | 64.00 | 62.00 | 65.00 | 62.00 | 65.00 | 62.00 | 63.00 |
| Characteristics | Mould Hardness |
| Process: | Moulding Process |
| USL | 70 |
| LSL | 60 |
| Pp | 1.06 |
| Ppk | 0.8 |
In the above example, the value of Ppk (0.8) is indicating that the process needs further improvement. The start-up process requires at least 1.33 and next to 1.67 and 2 onward.
QA/QC/TQM/Lean/6-Sigma Template or Format:


Useful Articles:
Quality at the source | Steps to Implement It
Jidoka Autonomation, Bakayoke & Yo-I-don |Concept in TPS
Pull Production System | Concept
Download QA & QC useful template/ format in free
More on TECHIEQUALITY


Thank you for reading… Keep visiting Techiequality.Com
Popular Post

Shanti Gopal Pradhan is an experienced professional in Quality Management Systems, QA, Operations, Business Excellence, and Process Improvement. He has strong expertise in international standards including IATF 16949, ISO 9001, ISO 14001, ISO 45001, and ISO 17025, along with methodologies such as TQM, TPM, and Six Sigma.
He holds a degree in Mechanical Engineering along with an MBA, combining strong technical acumen with strategic business insight, he is a Certified Internal Auditor, Lead Auditor, and Six Sigma Black Belt, with a proven track record in driving quality transformation and operational excellence.