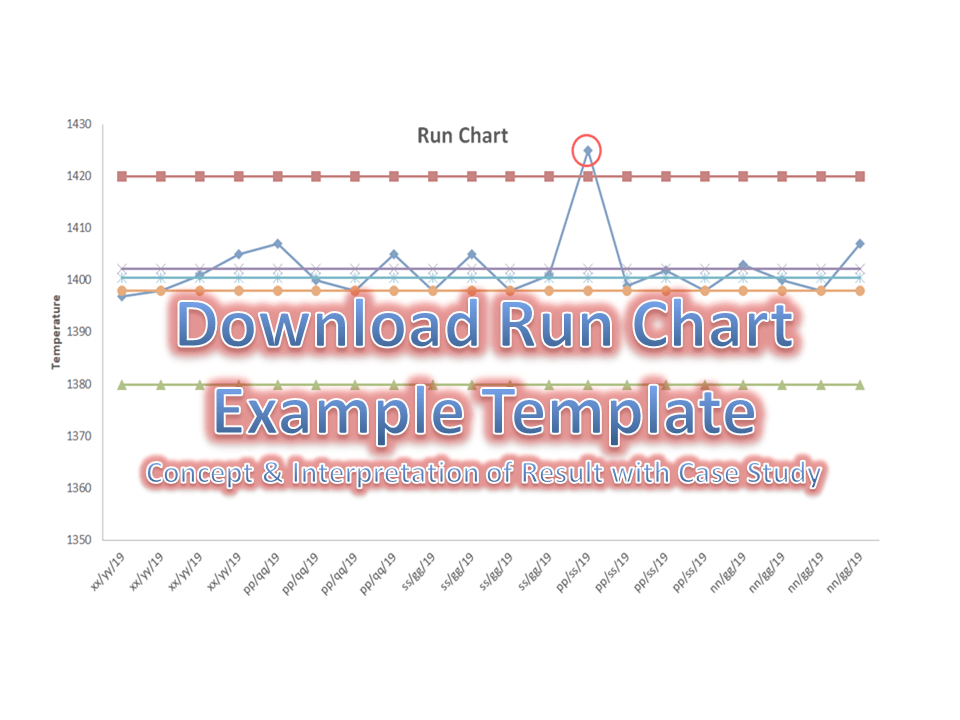
Run Chart Example | Concept & Interpretation of Result with Case Study | Industrial Example:
Hi readers! today we are going to discuss on Run Chart Example. A run chart is also called a Line graph. It’s a live Chart that you can use it on the shop floor to monitor the Process variation. In the run chart, you could able to set up the mean value, upper specification limit, and lower specification limit. A Run chart will not be able to give an idea about the control limits. It represents the variation in summarizing data of Process, or Product characteristics. However, it can show you how the process is running.
Download the Run Chart Example Template in Excel.
Interpretation of Result with Case Study:
- Interp.-1: Six or more consecutive points fall above or below the centre line (Median Line).
- Interp.-2: Five or more successive points are going up or down.
- Interp.-3: Too many or too few runs.
- Interp.-4: An astronomical data point.
If any, one of the above interpretations has been identified in the run chart, it means variation (non-random variation) present in the process’s characteristics.
Industrial Practical Example of Run Chart (Run Chart Example):
We are going to take an example from the Iron manufacturing industry. Such a company is produced as an automobile part with the following specifications.
Pouring Temperature =1400°C±20°C.
The company has decided to maintain the variation trend of Pouring temperature. They have implemented a run chart on the shop floor to monitor and measure the variation of pouring temperature w.r.t time period. The process engineer promptly started to measure the temperature readings four times a day (three working shifts) for five days. Below are the readings for your reference as;
Temperature Reading Table:
| Date | Observed Value |
| xx/yy/19 | 1397 |
| xx/yy/19 | 1398 |
| xx/yy/19 | 1401 |
| xx/yy/19 | 1405 |
| pp/qq/19 | 1407 |
| pp/qq/19 | 1400 |
| pp/qq/19 | 1398 |
| pp/qq/19 | 1405 |
| ss/gg/19 | 1398 |
| ss/gg/19 | 1405 |
| ss/gg/19 | 1398 |
| ss/gg/19 | 1401 |
| pp/ss/19 | 1425 |
| pp/ss/19 | 1399 |
| pp/ss/19 | 1402 |
| pp/ss/19 | 1398 |
| nn/gg/19 | 1403 |
| nn/gg/19 | 1400 |
| nn/gg/19 | 1398 |
| nn/gg/19 | 1407 |
Now, we are supposed to calculate the mean, median, and mode values to plot the run chart.
| Date | Observed Value | USL | LSL | Mean | Median | Mode |
| xx/yy/19 | 1397 | 1420 | 1380 | 1402.25 | 1400.5 | 1398 |
| xx/yy/19 | 1398 | 1420 | 1380 | 1402.25 | 1400.5 | 1398 |
| xx/yy/19 | 1401 | 1420 | 1380 | 1402.25 | 1400.5 | 1398 |
| xx/yy/19 | 1405 | 1420 | 1380 | 1402.25 | 1400.5 | 1398 |
| pp/qq/19 | 1407 | 1420 | 1380 | 1402.25 | 1400.5 | 1398 |
| pp/qq/19 | 1400 | 1420 | 1380 | 1402.25 | 1400.5 | 1398 |
| pp/qq/19 | 1398 | 1420 | 1380 | 1402.25 | 1400.5 | 1398 |
| pp/qq/19 | 1405 | 1420 | 1380 | 1402.25 | 1400.5 | 1398 |
| ss/gg/19 | 1398 | 1420 | 1380 | 1402.25 | 1400.5 | 1398 |
| ss/gg/19 | 1405 | 1420 | 1380 | 1402.25 | 1400.5 | 1398 |
| ss/gg/19 | 1398 | 1420 | 1380 | 1402.25 | 1400.5 | 1398 |
| ss/gg/19 | 1401 | 1420 | 1380 | 1402.25 | 1400.5 | 1398 |
| pp/ss/19 | 1425 | 1420 | 1380 | 1402.25 | 1400.5 | 1398 |
| pp/ss/19 | 1399 | 1420 | 1380 | 1402.25 | 1400.5 | 1398 |
| pp/ss/19 | 1402 | 1420 | 1380 | 1402.25 | 1400.5 | 1398 |
| pp/ss/19 | 1398 | 1420 | 1380 | 1402.25 | 1400.5 | 1398 |
| nn/gg/19 | 1403 | 1420 | 1380 | 1402.25 | 1400.5 | 1398 |
| nn/gg/19 | 1400 | 1420 | 1380 | 1402.25 | 1400.5 | 1398 |
| nn/gg/19 | 1398 | 1420 | 1380 | 1402.25 | 1400.5 | 1398 |
| nn/gg/19 | 1407 | 1420 | 1380 | 1402.25 | 1400.5 | 1398 |
By using the aforesaid data table, we have plotted a run chart/line chart with the help of Excel. But you can also plot the run chart by Minitab such a process we will discuss later in separate articles.
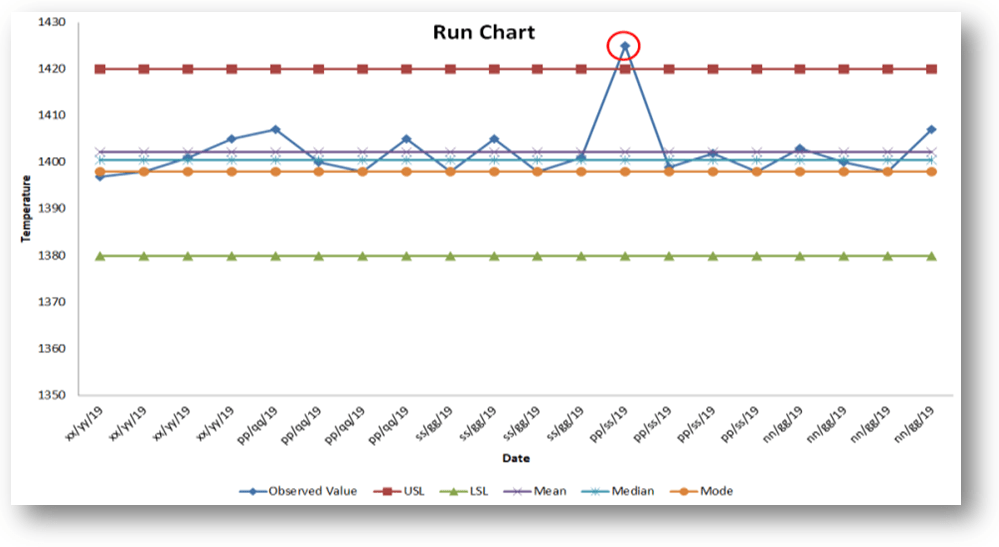
[Run Chart Plot by Excel]
Interpretation of the above run chart:
Before, we discuss the result of the above run chart. I would like to request you kindly go through the above chart prudently.
In the above chart, one reading (red highlighted point) suddenly goes up and the chart represents an astronomical data point interpretation. It means there is the existence of variation in the process and it is a non-random variation. In such a way you can plot the run chart to know how the process is running and according you could able to act on it.
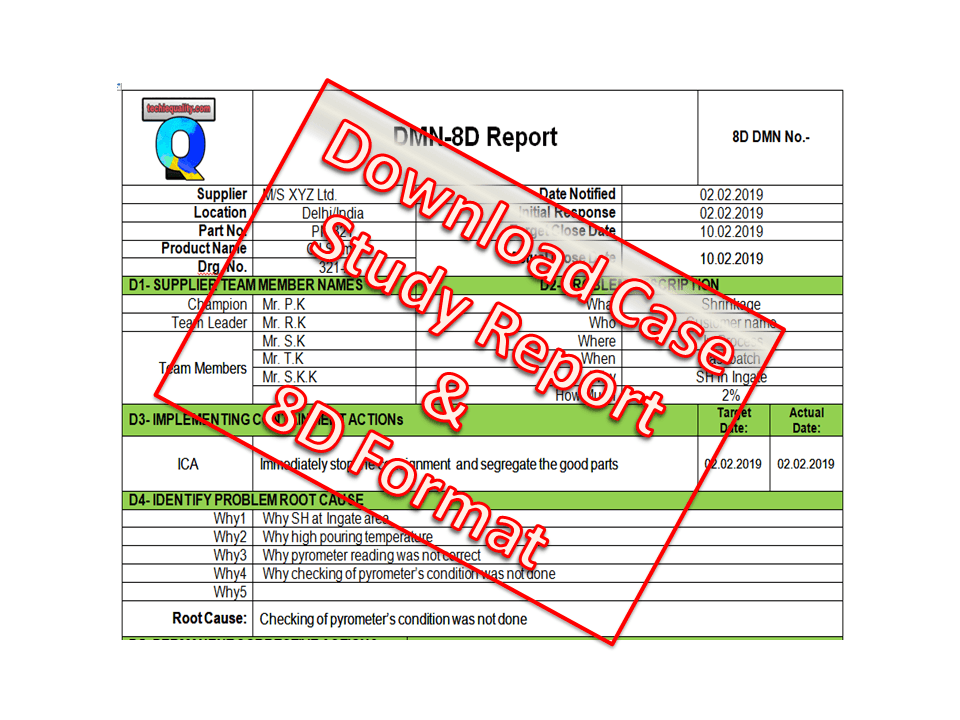
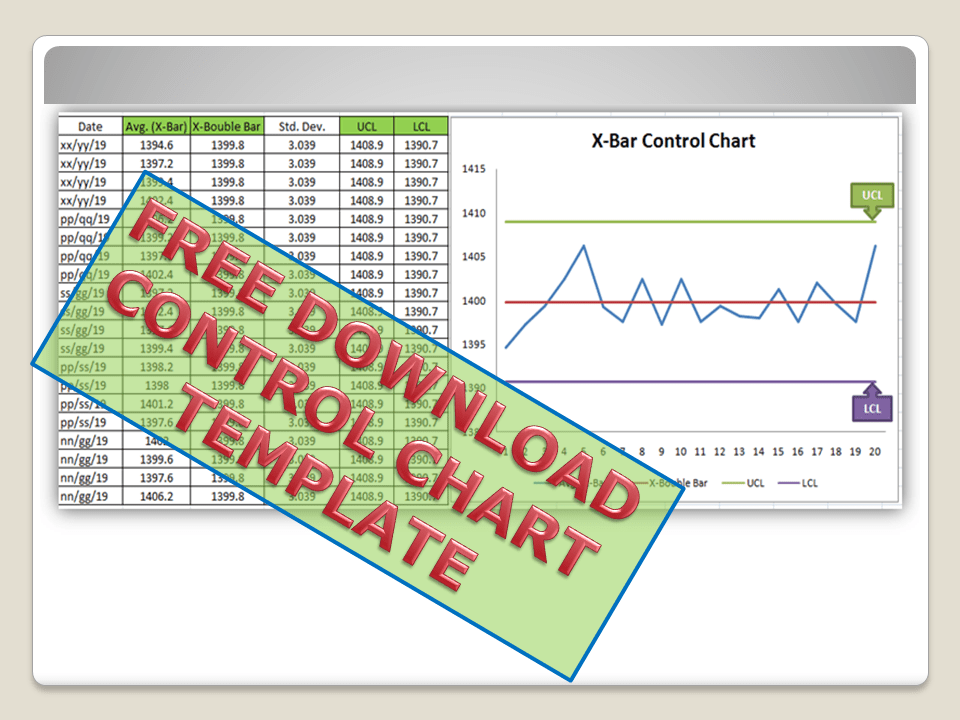
Useful Links: (Download Template)


Thank you for reading….Keep visiting Techiequality.Com
Popular Post:

Shanti Gopal Pradhan is an experienced professional in Quality Management Systems, QA, Operations, Business Excellence, and Process Improvement. He has strong expertise in international standards including IATF 16949, ISO 9001, ISO 14001, ISO 45001, and ISO 17025, along with methodologies such as TQM, TPM, and Six Sigma.
He holds a degree in Mechanical Engineering along with an MBA, combining strong technical acumen with strategic business insight, he is a Certified Internal Auditor, Lead Auditor, and Six Sigma Black Belt, with a proven track record in driving quality transformation and operational excellence.