How to calculate z-score in excel with a manufacturing example:
Hi Readers! Here, we are going to learn today how to calculate z-score in excel with manufacturing examples. And also we will understand the standard deviation calculation based on the sample and population. You can download the sample example excel template of z-score calculation from the below link as well.
Sample Excel Template of Z-score-[Free Download]
The formula of Z-Score calculation:
Z-Score = [xi-Mean]/ σ
Where xi is the observed value
µ =Mean
σ = Standard deviation of the population.
Before starting the calculation, we have to understand the variance and standard deviation of the sample and population, so that very easily we can calculate the value of Z-Score.
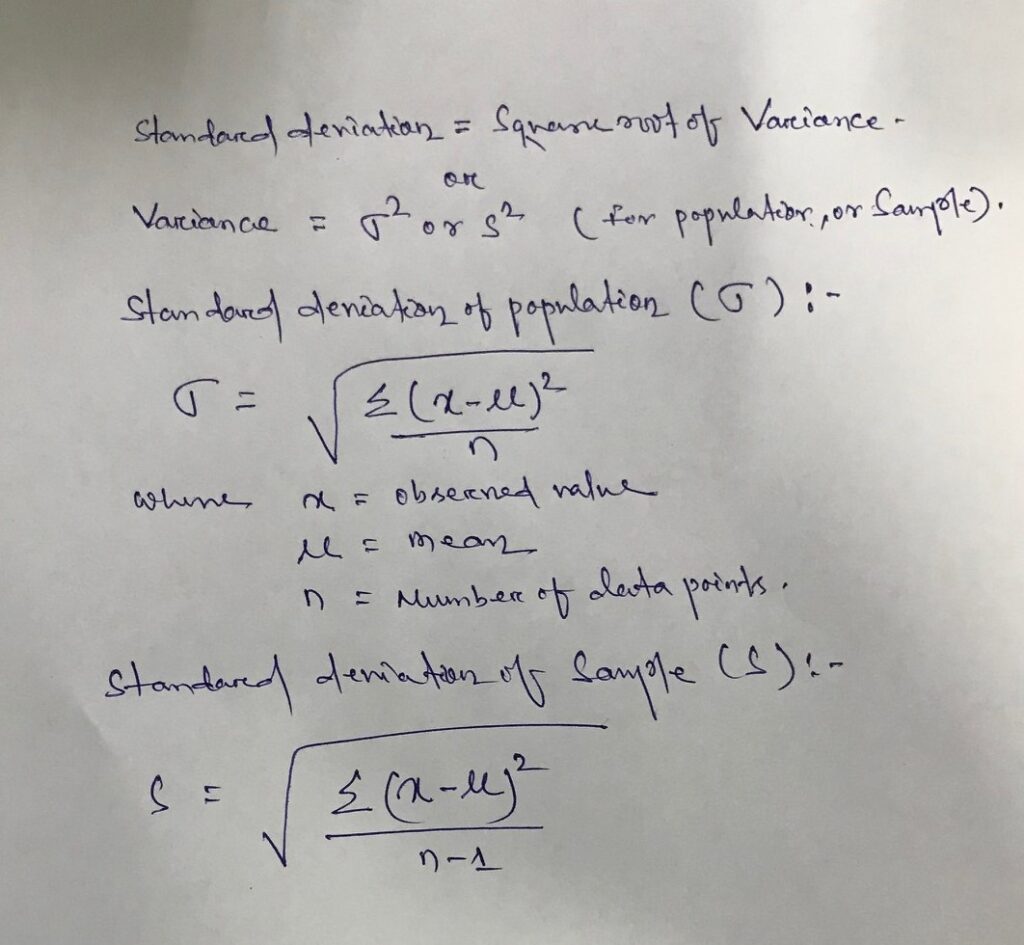
Relation between variance and standard deviation:
Standard Deviation is equal to the square root of the variance
σ or s = Square root of the variance
Variance = σ2 or s2
How to calculate z-score in excel with manufacturing example
For example, there is a 5 nos total data set that we have observed and these are given below as
Data set = [294, 295, 296, 295, 310], and the company has set the range of -1 to 1 as “not an outlier”. The individual data value which is greater than 1 or less than -1 is the outlier value from the data set.
By using the above formula we are going to calculate the Z-score manually and then by Excel sheet.
Manual calculation of Z-Score:
Data set- = 294, 295, 296, 295, 310.
Z-Score = [xi-Mean]/ σ
Where, X1=294, X2=295, X3=296, X4=295, X5=310
Total number of data points (n) = 5
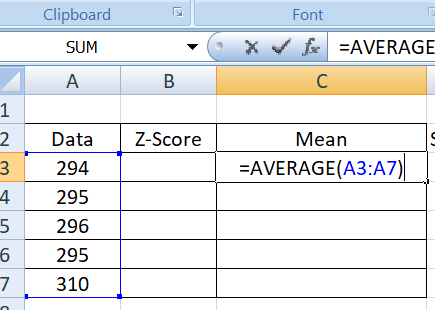
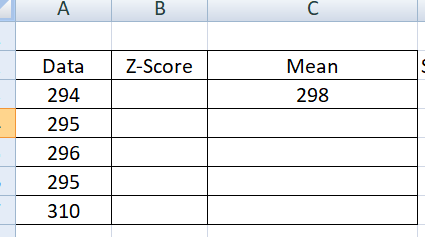
Mean of data set = (294 + 295 + 296 + 295 + 310)/5 = 298
| Data | x-µ | (x-µ)2 | Sum of (x-µ)2/n | Square root of (Sum of (x-µ)2/n) |
| 294 | -4 | 16 | 36.4 | 6.03 |
| 295 | -3 | 9 | ||
| 296 | -2 | 4 | ||
| 295 | -3 | 9 | ||
| 310 | 12 | 144 | ||
| Sum = | 182 |
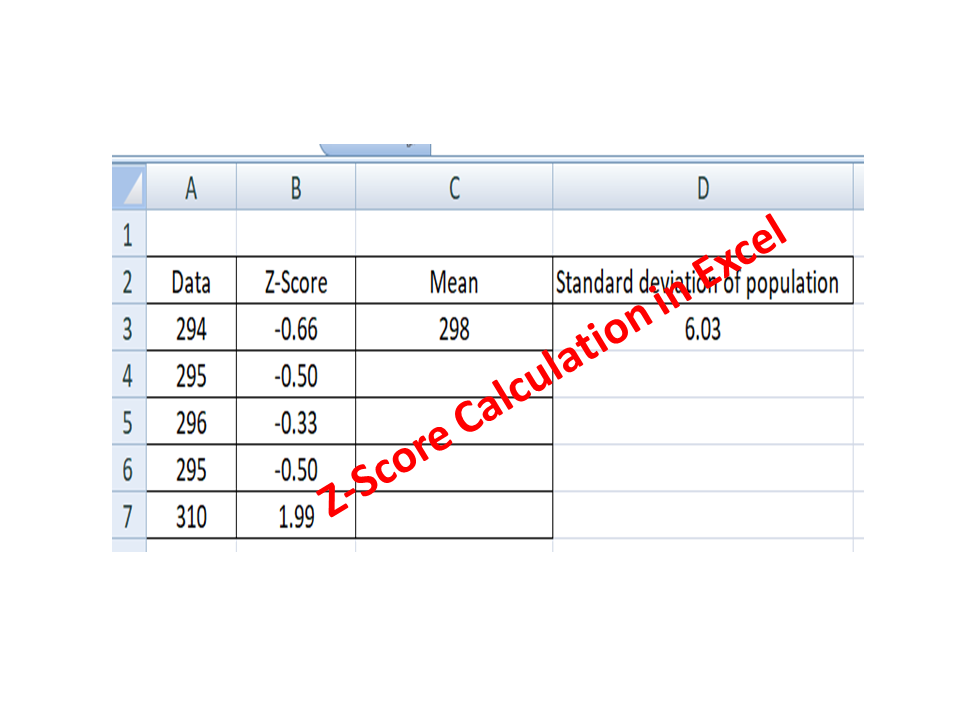
Mean, µ = 298, Standard deviation of population = 6.03, so Z-score is equal =
Z-Score = [xi-Mean]/ σ
For data value “294” Z-score equal to = (294-298)/6.03 = -0.66, similarly we have calculated the z-score for data set.
| Data | Z-Score |
| 294 | -0.66 |
| 295 | -0.50 |
| 296 | -0.33 |
| 295 | -0.50 |
| 310 | 1.99 |
Excel Calculation Methods:
Step-1: Open the excel sheet
Step-2: Type the data value like below in the Excel sheet
| Data |
| 294 |
| 295 |
| 296 |
| 295 |
| 310 |
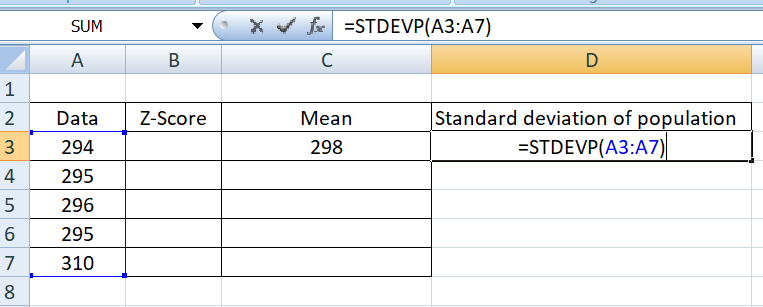
Step-3: Use the below Excel function formula to calculate the mean
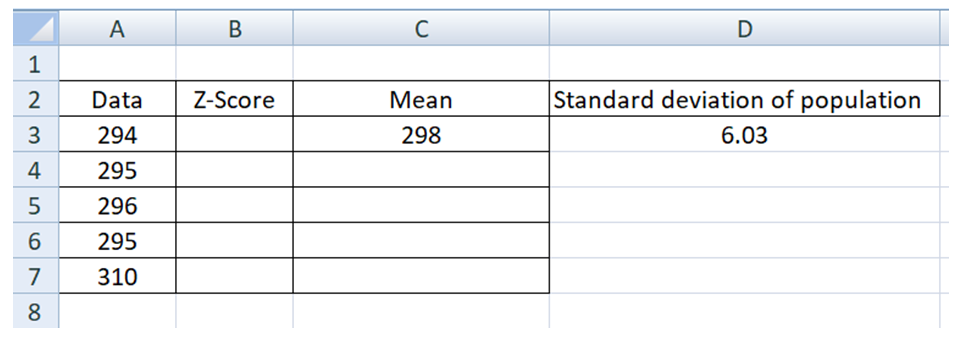
Step-4: Use below excel function formula to calculate the standard deviation of the data set.
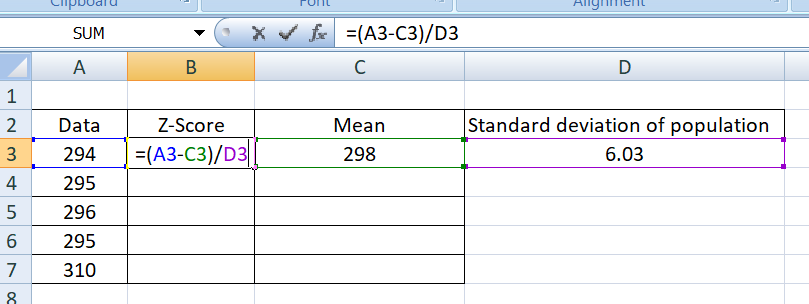
Step-5: Use the below function formula to calculate the individual Z-score of all data value
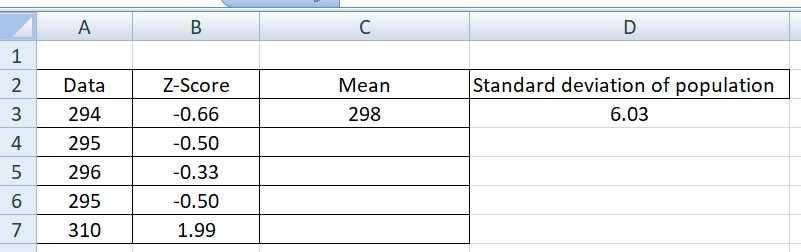
Conclusion and data interpretation: As per the organization outlier criteria, the data value 310 is the outlier data among the above data set because the Z-score is 1.99 which is greater than the value of 1
Free Templates / Formats of QM: we have published some free templates or formats related to Quality Management with manufacturing / industrial practical examples for better understanding and learning. if you have not yet read these free template articles/posts then, you could visit our “Template/Format” section. Thanks for reading…keep visiting techiequality.com
Popular Post

Shanti Gopal Pradhan is an experienced professional in Quality Management Systems, QA, Operations, Business Excellence, and Process Improvement. He has strong expertise in international standards including IATF 16949, ISO 9001, ISO 14001, ISO 45001, and ISO 17025, along with methodologies such as TQM, TPM, and Six Sigma.
He holds a degree in Mechanical Engineering along with an MBA, combining strong technical acumen with strategic business insight, he is a Certified Internal Auditor, Lead Auditor, and Six Sigma Black Belt, with a proven track record in driving quality transformation and operational excellence.