Six Sigma Green Belt Test Questions | 60+ Q&A with Example and Concept

Six Sigma Green Belt Test Questions

Six Sigma Green Belt Test Questions | 60+ Q&A with Example and Concept

Hi Readers, Today, we will be discussing an important topic on Six Sigma Green Belt Test Questions. Six Sigma Green Belt certification is one of the most recognized quality management credentials across manufacturing, automotive, healthcare, IT, logistics, and service industries. Green Belt professionals lead process improvement projects, reduce defects, improve customer satisfaction, and drive operational excellence using data-driven methodologies. This guide covers objective questions, practical questions, experience-based interview questions, and scenario-based questions with answers & examples.

Preparing for the green belt six sigma practice exam requires a strong understanding of:
  • DMAIC Methodology
  • Lean Principles
  • Statistical Analysis
  • Process Capability
  • Root Cause Analysis
  • Control Plans
  • Continuous Improvement
  • SIPOC
  • VSM
  • 7QC tools
  • 5 core tools
  • Hypothesis testing tools
The primary objectives of a green belt six sigma professional are:
  1. Reduce process variation.
  2. Eliminate defects and waste.
  3. Improve customer satisfaction.
  4. Increase process capability.
  5. Improve operational efficiency.
  6. Support organizational business goals.
  7. Lead DMAIC improvement projects.

Opportunity to lead and support nearly 200 improvement projects, including both Green Belt and Black Belt initiatives across various functions and industries.

Throughout this journey, I have gained extensive practical experience in problem-solving, process improvement, statistical analysis, project management, and business excellence methodologies. While certification examinations assess theoretical understanding, project execution provides invaluable insights that help professionals apply these concepts effectively.

To support both new and experienced professionals preparing for Six Sigma certification, I would like to share a collection of important and practical questions, along with key learning points, that are frequently encountered during project implementation and certification preparation. These questions are designed to strengthen conceptual understanding, enhance analytical thinking, and improve examination performance.

I hope this knowledge-sharing initiative will help aspiring Six Sigma professionals build confidence, deepen their expertise, and successfully achieve their certification goals while creating measurable business impact.

Wishing all certification aspirants the very best in their learning and professional development journey.

Six Sigma Green Belt Test Questions

Basic Six Sigma Green Belt Objective Questions

1. What does DMAIC stand for?

A. Define, Measure, Analyse, Improve, Control
B. Develop, Measure, Assess, Improve, check
C. Define, Manage, Analyse, Implement, Control
D. Develop, Measure, Analyse, Improve, Confirm

Answer: A

2. What is Six Sigma primarily focused on?

A. Increasing inventory
B. Reducing variation and defects
C. Increasing manpower
D. Reducing production volume

Answer: B

3. Which phase identifies customer requirements?

A. Measure
B. Analyse
C. Define
D. Improve

Answer: C

4. What is CTQ?

A. Critical To Quality
B. Customer Technical Quality
C. Cost To Quality
D. Critical Team Quality

Answer: A

5. Which tool is commonly used for root cause analysis?

A. Fishbone Diagram
B. Histogram
C. Check Sheet
D. Control Plan

Answer: A

DMAIC Practical Questions

6. A production line has a defect rate of 8%. What DMAIC phase should be used to identify reasons for defects?

Answer: Analyse Phase

Explanation:
During Analyse, teams identify root causes using tools such as:

  • Fishbone Diagram
  • 5 Why Analysis
  • Pareto Analysis
  • Regression Analysis

7.Customer complaints have increased by 30%.Which DMAIC phase should begin first?

Answer: Define Phase

Reason:
The problem statement, project charter, scope, stakeholders, and customer requirements must first be defined.

Statistical Questions

8. What does a process capability index (Cpk) greater than 1.33 indicate?

A. Poor process performance
B. Marginal process capability
C. Capable process
D. Unstable process

Answer: C

9. What does standard deviation measure?

A. Average value
B. Process variation
C. Defect count
D. Yield

Answer: B

10. Which chart monitors variable data?

A. P Chart
B. C Chart
C. X-Bar Chart
D. NP Chart

Answer: C

11. What are the 8 wastes in Lean?

Answer:

  1. Defects
  2. Overproduction
  3. Waiting
  4. Non-utilized Talent
  5. Transportation
  6. Inventory
  7. Motion
  8. Extra Processing

Remember using acronym: DOWNTIME

12. What is Kaizen?

A. Statistical analysis
B. Continuous improvement
C. Process audit
D. Control chart

Answer: B

Scenario-Based Six Sigma Green Belt Test Questions

Scenario 1: Manufacturing Defect Reduction

Situation: An automotive component manufacturing plant reports:

  • Monthly production = 10,000 units
  • Defective units = 600

Management wants to reduce defects.

Question: Which Six Sigma approach should be applied?

Answer

DMAIC methodology.

Steps

Define

Problem: 6% defect rate causing customer complaints.

Measure

Collect defect data.

Analyse

Use:

  • Pareto Chart
  • Fishbone Diagram
  • 5 Why Analysis

Improve

Implement:

  • Operator training
  • Process standardization
  • Error proofing (Poka-Yoke)

Control

Monitor using control charts.

Expected Result

Defect rate reduced from 6% to below 2%.

Scenario 2: AMR Manufacturing Example

Situation: An Autonomous Mobile Robot (AMR) manufacturer experiences recurring field failures due to Lidar connector looseness.

Question

How would you investigate?

Answer

Define

Field failures due to intermittent Lidar communication.

Measure

Collect:

  • Failure frequency
  • Failure location
  • Operating hours

Analyse

Use 5 Why Analysis.

Example:

Why failure?
→ Connector disconnected.

Why disconnected?
→ Excessive vibration.

Why vibration affected connector?
→ Improper harness routing.

Why improper routing?
→ No routing standard.

Root Cause:
Lack of harness routing standard.

Improve

  • Increase harness length.
  • Improve bend radius.
  • Add strain relief.
  • Update assembly SOP.

Control

  • Periodic audits.
  • Validation testing.
  • First-off inspection.

Scenario 3: Service Industry Example

Situation

Customer support ticket closure time increased from 24 hours to 72 hours.

Question

What Lean Six Sigma tools would you use?

Answer

  1. SIPOC
  2. Process Mapping
  3. Value Stream Mapping
  4. Pareto Analysis
  5. Root Cause Analysis

Likely findings:

  • Resource shortage
  • Approval delays
  • Manual data entry

Experience-Based Six Sigma Green Belt Test Questions

1.Describe a Six Sigma project you completed.

Sample Answer

I led a defect reduction project in an automotive assembly process where defect rates were 4.5%.

Using DMAIC:

  • Identified top defect categories
  • Conducted root cause analysis
  • Implemented process controls

Results:

  • Defects reduced to 1.2%
  • Annual savings of ₹25 Lakhs
  • Improved customer satisfaction

Question 2: How have you used Pareto Analysis?

Sample Answer

In a manufacturing quality project, Pareto analysis revealed that 80% of defects originated from three defect categories.

Focusing corrective actions on these categories reduced overall defects by 50%.

Question 3

Explain a successful root cause analysis.

Sample Answer

We observed repeated AMR field failures.

Using:

  • Fishbone Diagram
  • 5 Why Analysis

We discovered improper cable routing causing connector stress.

After redesigning routing standards, failures dropped significantly.

Advanced Six Sigma Green Belt Test Questions

1. What is DPMO?

Defects Per Million Opportunities.

Formula:

DPMO = {Defects/ (Units x opportunities)}x1000000

2. What is a Sigma Level?

Sigma level measures process capability and defect performance.

Higher sigma = fewer defects. For example, 6 sigma = 3.4 defects per million

3. What is Poka-Yoke?

A mistake-proofing method designed to prevent human errors before defects occur.

Examples:

  • Sensor-based assembly verification
  • Barcode validation systems

Phase-wise Six Sigma Green Belt Test Questions

Define Phase Questions

1. What is the primary purpose of the Define phase?

Answer: To clearly define the problem, project scope, goals, customer requirements, and stakeholders.

2. What is a Project Charter?

Answer: A document that formally authorizes a Six Sigma project and includes:

  • Problem Statement
  • Business Case
  • Goal Statement
  • Scope
  • Timeline
  • Team Members

3. What is VOC?

Answer: Voice of Customer.

It represents customer expectations, needs, and requirements.

4. What is SIPOC?

Answer:

S – Suppliers
I – Inputs
P – Process
O – Outputs
C – Customers

Used to understand a process at a high level.

5. Why is a SIPOC diagram useful?

Answer:
It helps identify process boundaries and stakeholders before detailed analysis begins.

Measure Phase Questions

6. What is a Baseline Measurement?

Answer:
The current performance level before improvements is implemented.

7. Why is data collection important?

Answer:
Improvement decisions should be based on facts and data rather than assumptions.

8. What is a Check Sheet?

Answer:
A structured form used to collect and organize data.

9.What is Yield?

Yield = {Good units/Total units} x 100

Answer:
The percentage of defect-free products produced.

10. What is Rolled Throughput Yield (RTY)?

Answer:
The probability that a unit passes through an entire process without defects.

Analyse Phase Questions

11. What is Root Cause Analysis?

Answer:
A systematic method to identify the fundamental cause of a problem.

12. What is the 5 Why Technique?

Answer:
A problem-solving technique that repeatedly asks “Why?” until the root cause is identified.

13. What is a Fishbone Diagram?

Answer:
A visual tool used to categorize potential causes of a problem.

Categories often include:

  • Man
  • Machine
  • Method
  • Material
  • Measurement
  • Environment

14. What is Pareto Analysis?

Answer:
A method based on the 80/20 rule where a small number of causes contribute to most problems.

15. What is Correlation?

Answer:
A measure showing the relationship between two variables.

Improve Phase Questions

16. What is Poka-Yoke?

Answer:
Mistake-proofing techniques that prevent errors from occurring.

Example:
A connector designed to fit only in one direction.

17. What is Kaizen?

Answer:
Continuous improvement through small incremental changes.

18. Why conduct pilot runs?

Answer:
To verify improvements before full implementation.

19. What is Cost of Poor Quality (COPQ)?

Answer:
Costs associated with defects, rework, scrap, warranty claims, and customer complaints.

20. What is Risk Assessment?

Answer:
The process of identifying and evaluating potential risks before implementing changes.

Control Phase Questions

21. What is a Control Plan?

Answer:
A document that ensures process improvements are sustained.

22. What is Statistical Process Control (SPC)?

Answer:
A method of monitoring and controlling processes using statistical tools.

23. What is a Control Chart?

Answer:
A graph used to monitor process stability over time.

24. What are Upper and Lower Control Limits?

Answer:
Boundaries indicating expected process variation.

25. Why is process standardization important?

Answer:
It ensures consistency and prevents recurrence of defects.

Statistical Questions

26. What is Mean?

Answer:
The average of a dataset.

27. What is Median?

Answer:
The middle value when data is arranged in order.

28. What is Mode?

Answer:
The value that occurs most frequently.

29. What is Standard Deviation?

Answer:
A measure of variation or spread in a dataset.

30. Why is a low standard deviation desirable?

Answer:
It indicates consistent process performance.

Process Capability Questions

31. What does Cp measure?

Answer:
Potential process capability.

32. What does Cpk measure?

Answer:
Actual process capability considering process centering.

33. What does Cpk less than 1 indicate?

Answer:
The process is not capable of consistently meeting specifications.

34. What is considered a good Cpk value?

Answer:
Generally, 1.33 or higher.

35. Why monitor process capability?

Answer:
To determine whether the process can meet customer requirements.

Lean Six Sigma Questions

36. What is Value-Added Activity?

Answer:
An activity the customer is willing to pay for.

37. What is Non-Value-Added Activity?

Answer:
An activity that consumes resources without adding customer value.

38. What is Value Stream Mapping?

Answer:
A visual representation of material and information flow.

39. What is Takt Time?

Take Time = Available Production Time/Customer Demand

40. What is Just-In-Time (JIT)?

Answer:
Producing only what is needed, when needed, in the required quantity.

Scenario-Based Questions

41. Scenario: AMR Battery Failure

An AMR battery is failing after 100 charging cycles instead of the specified 500 cycles.

Question: Which Six Sigma tools would you use?

Answer:

  • Pareto Analysis
  • Fishbone Diagram
  • 5 Why Analysis
  • DOE (Design of Experiments)
  • Process Capability Analysis

42. Scenario: High Dispatch Errors

Warehouse dispatch accuracy dropped from 99% to 94%.

Answer:
Investigate:

  • Picking process
  • Barcode scanning
  • Training effectiveness
  • Standard operating procedures

43. Scenario: Customer Complaints Increased

Complaints increased by 40%.

Question: What should be your first step?

Answer:
Collect VOC data and define the problem clearly.

44. Scenario: Production Cycle Time Increased

Cycle time increased from 5 minutes to 8 minutes.

Answer:
Perform:

  • Time Study
  • Process Mapping
  • Bottleneck Analysis
  • Value Stream Mapping
45. Scenario: Rework Increased

A manufacturing process shows increasing rework levels.

Answer:
Analyse:

  • Operator skill
  • Machine condition
  • Incoming material quality
  • Process parameters

46. How did Six Sigma help your organization?

Sample Answer:

Six Sigma reduced defect rates by identifying root causes and implementing process controls, resulting in improved customer satisfaction and cost savings.

47. Describe a successful CAPA project.

Sample Answer:

Field failures were traced to improper cable routing. We updated design standards, implemented training, and established validation checks. Failures reduced significantly.

48. How do you handle resistance to change?

Sample Answer:

By involving stakeholders early, presenting data-based evidence, and demonstrating benefits through pilot projects.

49. How do you prioritize improvement opportunities?

Sample Answer:

Using Pareto Analysis, risk assessment, customer impact, and business value.

50. What is the biggest mistake in Six Sigma projects?

Answer:

Jumping directly to solutions without:

  • Defining the problem clearly
  • Collecting accurate data
  • Identifying the true root cause

This often leads to ineffective corrective actions and recurring problems.

A process produces 50,000 units with 250 defects. Each unit has 5 defect opportunities.

Calculate DPMO.

DPMO = {250 x 1000000 /(50000 x 5)}

Answer:

DPMO = 1,000

Basic Hypothesis Testing Six Sigma Green Belt Test Questions

Hypothesis testing is a critical topic in Six Sigma Green Belt certification exams. It helps determine whether process changes, supplier differences, machine variations, or quality improvements are statistically significant.

1. What is Hypothesis Testing?

Answer:
Hypothesis testing is a statistical method used to determine whether a claim about a population is likely to be true based on sample data.

2. What are the two hypotheses used in hypothesis testing?

Answer:

Null Hypothesis (H₀):
Assumes no difference or no effect exists.

Alternative Hypothesis (H₁ or Ha):
Assumes a difference or effect exists.

Example:

H₀: New process cycle time = Old process cycle time

H₁: New process cycle time ≠ Old process cycle time

3. What is the purpose of the Null Hypothesis?

Answer:
The null hypothesis serves as the default assumption that there is no significant difference between groups or processes.

4. What is a P-value?

Answer:
The probability of obtaining the observed result if the null hypothesis is true.

Decision Rule

  • P-value ≤ 0.05 → Reject H₀
  • P-value > 0.05 → Fail to Reject H₀

5. What is the significance level (α)?

Answer:
The maximum acceptable risk of rejecting a true null hypothesis.

Common value:

α = 0.05 (5%)

Type I and Type II Error Questions

6. What is a Type I Error?

Answer:

Rejecting a true null hypothesis.

Example:

Concluding a new supplier is better when actually there is no difference.

7. What is a Type II Error?

Answer:

Failing to reject a false null hypothesis.

Example:

Concluding there is no supplier difference when one actually exists.

8. Which error is called “False Alarm”?

Answer:
Type I Error.

9. Which error is called “Missed Detection”?

Answer:
Type II Error.

One-Tailed and Two-Tailed Test Questions

10. When is a One-Tailed Test used?

Answer:
When the direction of change is important.

Example:

Testing whether a new process reduces defects.

H₁: Defect Rate < Current Defect Rate

11. When is a Two-Tailed Test used?

Answer:
When testing for any difference.
Example:

H₁: Mean Cycle Time ≠ Existing Cycle Time

t-Test Questions

12. What is a One-Sample t-Test?

Answer:
Compares a sample mean against a target value.

Example:

Target Cycle Time = 20 min

Sample Mean = 18 min

13. What is a Two-Sample t-Test?

Answer:
Compares means of two independent groups.

Example:

Machine A vs Machine B

14. What is a Paired t-Test?

Answer:
Compares measurements before and after a process change on the same sample.

Example:

Cycle time before automation and after automation.

15. A process improvement project resulted in a p-value of 0.02. What should be concluded?

Answer:

Since:

0.02 < 0.05

Reject H₀.

The improvement is statistically significant.

ANOVA Questions

16. What does ANOVA stand for?

Answer:

Analysis of Variance

17. When is ANOVA used?

Answer:
To compare means of three or more groups.

Example:

Comparing output from:

  • Machine A
  • Machine B
  • Machine C

18. What is the Null Hypothesis in ANOVA?

Answer:

H₀:
All group means are equal.

19. What is the Alternative Hypothesis in ANOVA?

Answer:

At least one group mean is different.

Chi-Square Test Questions

20. When is Chi-Square used?

Answer:
For categorical data.

Example:

Determining whether defect type depends on production shift.

21. Give an example of a Chi-Square Test.

Answer:

Testing whether:

  • Day Shift
  • Night Shift

have different defect distributions.

22. Scenario: New Supplier Approval

Supplier A defect rate = 2%

Supplier B defect rate = 4%

Question:
Which test should be used?

Answer:
2-Proportion Test

Because defect rates are proportions.

23. Scenario: Comparing Machine Outputs

Three machines produce the same component.

Question:
Which test should be used?

Answer:
ANOVA

Since more than two groups are being compared.

24. Scenario: Before and After Improvement

Cycle time before improvement = 15 min

Cycle time after improvement = 12 min

Question:
Which test should be used?

Answer:
Paired t-Test

25. Scenario: Process Target Verification

Target weight = 100 g

Sample average = 98 g

Question:
Which test should be used?

Answer:
One-Sample t-Test

Six Sigma Green Belt Ultimate Quick Memory Tricks

DMAIC = Roadmap of Six Sigma

Memory Trick:

D M A I C

Define → What is the problem?
Measure → How bad is it?
Analyse → Why is it happening?
Improve → Fix it.
Control → Sustain it.

Easy Phrase:

“Define, Measure, Analyse, Improve, Control”

Problem → Data → Cause → Solution → Sustain

8 Wastes of Lean

Memory Trick:

DOWNTIME

LetterWaste
DDefects
OOverproduction
WWaiting
NNon-utilized Talent
TTransportation
IInventory
MMotion
EExtra Processing

Root Cause Analysis

Memory Trick:

5 Why = Dig Until Root Cause

Problem → 1Why? → 2Why? →–3Why? -→ 4Why? → 5Why?

Never stop at symptoms.

4. Fishbone Categories

Memory Trick:

6M

  • Man
  • Machine
  • Method
  • Material
  • Measurement
  • Mother Nature (Environment)

Process Capability

Memory Trick:

Cp = Potential

Cpk = Actual Performance

Think: “Cpk keeps process centered.”

Green Belt Thumb Rule

CpkMeaning
<1Poor
1.0Barely Capable
1.33Good
1.67+Excellent

6 Sigma = 3.4 defects per million

This is the most frequently asked Six Sigma exam question.

Hypothesis Testing Shortcut

P-Value Rule

P ≤ 0.05 → Reject H₀

P > 0.05 → Fail to Reject H₀

Memory Trick

Small P = Big Difference

Control Charts

Memory Trick

Variable Data: X-Bar & R Chart

Examples:

  • Weight
  • Length
  • Voltage

Attribute Data: P, NP, C, U Charts

Examples:

  • Defects
  • Rejects
  • Pass/Fail

Pareto Principle

Memory Trick

80/20 Rule

80% Problems ← 20% Causes

Focus on the “Vital Few.”

Cost of Quality (COQ)

Memory Trick: PAFF

LetterMeaning
PPrevention
AAppraisal
FInternal Failure
FExternal Failure

Thanks for Reading… Keep visiting TECHIEQUALITY.

3MU Check sheet | Details of MURA, MURI & MUDA | Download

3MU Check sheet

3MU Check sheet | Details of MURA, MURI & MUDA:

Hi Readers! Today we will discuss here details on MURA, MURI & MUDA. you can download our free template of the 3MU check sheet from the below links. The 3MU’s are MURA (Discrepancy), MURI (Strain), MUDA Waste).

DOWNLOAD-3MU Check Sheet. (MUDA).

3MU Check sheet
3MU Check sheet- download

The 3MU can be applied in the below fields;

  • Method of operation.
  • Manpower.
  • Process involved.
  • Technique.
  • Facilities.
  • Time.
  • Jigs & Tools.
  • Materials.
  • Inventory.
  • Production Volume.
  • Place.
  • Way of thinking.

Details of MURA, MURI & MUDA:

MURA MURI MUDA
Unevenness, Discrepancy, Irregular Unreasonableness, Strain, Overdoing, Overburdened Unusefulness, Waste.
Any variation leading to unbalanced situations. A system, facility, or process designed beyond the physical capacities of equipment/ workforce Activities which does not add value.
MUDA: Waste, Unusefulness;

An any activities that do not add value w.r.t the customer perspective, presently in industry; elimination of waste (MUDA) is the big challenge. Many lean tools are there that you can implement it to deduce the MUDA. Value stream mapping is the one of the popular tools that basically used in many industries. But the identification of waste is a big job. The common 7 wastes are;

  1. Defects: The Defective product is total waste.
  2. Overproduction: Production more than demand or less than demand is a loss.
  3. Over Processing: Rework, Repair, Rechecking is a waste of time and money.
  4. Waiting: Waste of time, and money.
  5. Moving: The movement of goods within or outside is waste.
  6. Inventory: Unfinished goods, R/M, BOP add no value.
  7. Transportation: Unnecessary transfer of goods is waste.

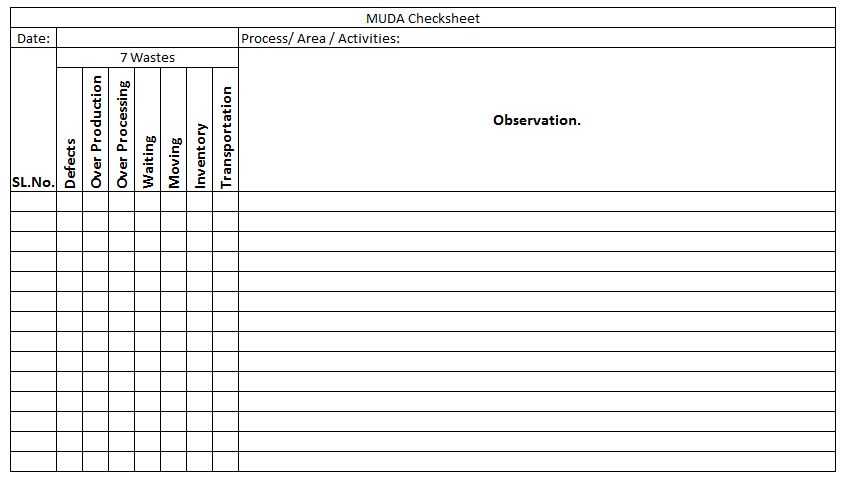
Considering with above points we have prepared a sample MUDA Checklist for your ready reference. DOWNLOAD the MUDA Check sheet.

MURA: Unevenness, Discrepancy, Irregular;

MURA can exist when the workflow is out of balance.

MURI: Unreasonableness, Strain, Overdoing, Overburdened;

A system, facility, or process designed beyond the physical capacities of equipment/ workforces.

How to eliminate 3MUs?

The MURA (Unbalanced Process) can lead to an overburden on the workforce or equipment which may cause later on all kinds of non-value-added activities (MUDA). So to eliminate the 3MUs you have to give more focus on Value stream mapping, Process layout design, and 5’S, Visual standard, Kaizen, Process feasibility analysis, and Process variation.

Example:

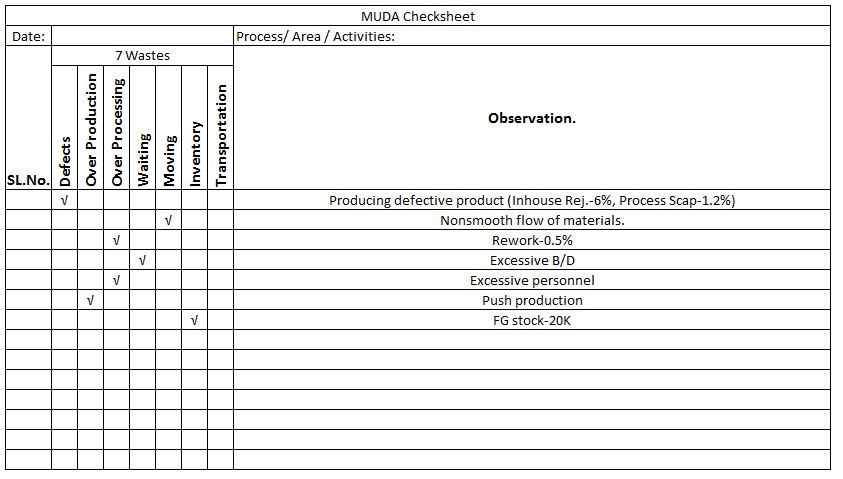
You can audit your respective area by using our 3MU-MUDA Check Sheet, Similarly, we have done this in the manufacturing unit and found some observations, same mentioned in below for your easy understanding.

3MU Check sheet
3MU Check sheetdownload

We have taken some initiatives against the above findings (Observation) to eliminate the MUDA in the process as;

Observations Management Initiative
Producing defective product TQM, QA
The Nonsmooth flow of materials KANBAN, JIT, PPC
Rework-0.5% TQM, QA
Excessive B/D TPM
Excess Production Pull Production, PPC
FG Stock-High Inventory Management, World class Supply chain Management
Useful Articles:

4M Checklist Template |Free Download Format

SPC Format |DOWNLOAD Excel Template of SPC Study

why why analysis methodology | 5-why analysis step by step guide

How to measure process capability (Cp & Cpk)? Download Excel Template

Error Proofing Understanding & Implementation of IATF 16949 Clauses 10.2.4

Pareto Chart Example of Manufacturing Units

Thank you for reading…keep visiting Techiequality.Com

Popular Post:

Kaizen vs Innovation | Key Differences between Kaizen and Innovation

Kaizen vs Innovation

Kaizen vs Innovation | Key Differences between Kaizen and Innovation

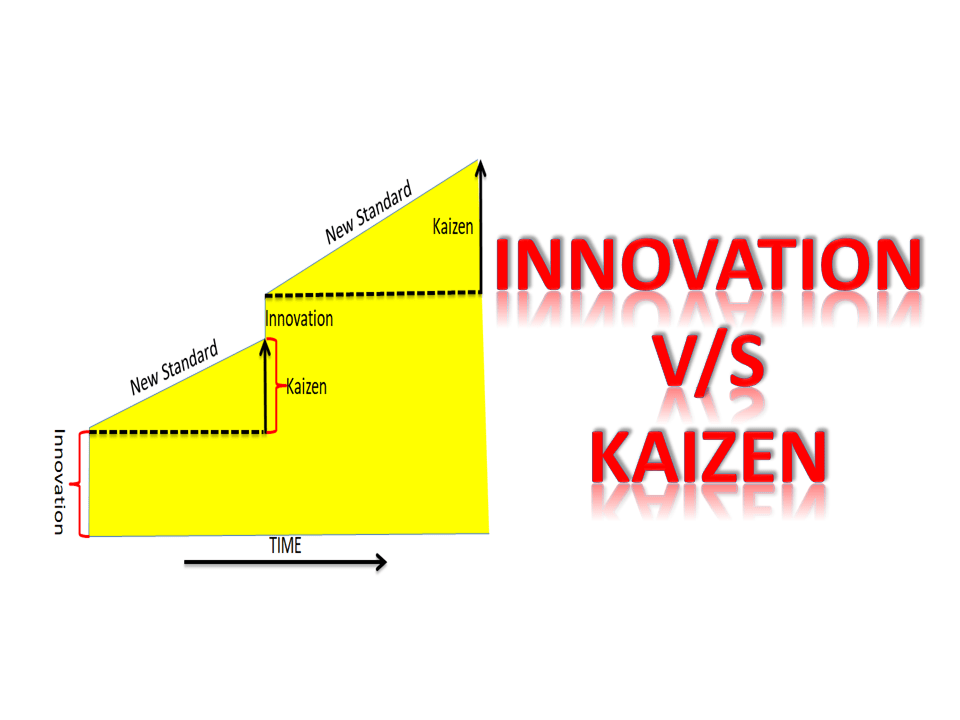
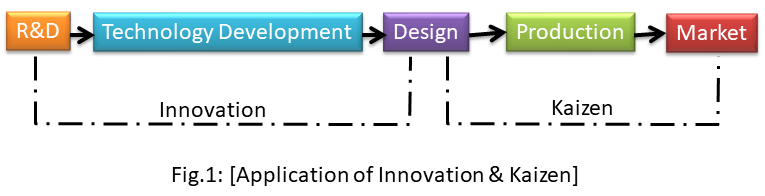
Kaizen vs Innovation: Both kaizen and Innovation can be applied at every stage in Manufacturing. But in normal circumstances, these two are applied in two different stages.

Kaizen vs Innovation

In the aforesaid figure, its clearly indicates that the Innovation phase can be started from scientific development i.e. R&D, and leads to new technology and later to design in this order. But the Kaizen phase is giving more emphasis on Gemba Kaizen (Work Place Kaizen).

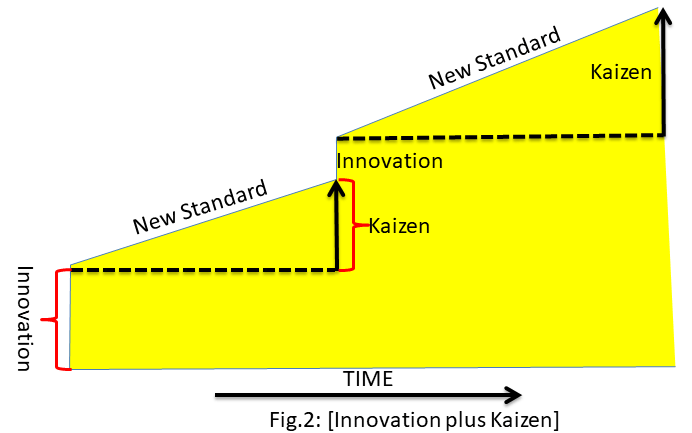
Diagrammatic Comparison Between Kaizen vs Innovation:

Kaizen vs Innovation

In the above Fig. 2, it clearly indicates that, if an organization starts both the innovation plus kaizen culture, then it will take very little time to achieve a high level of improvement in all aspects.

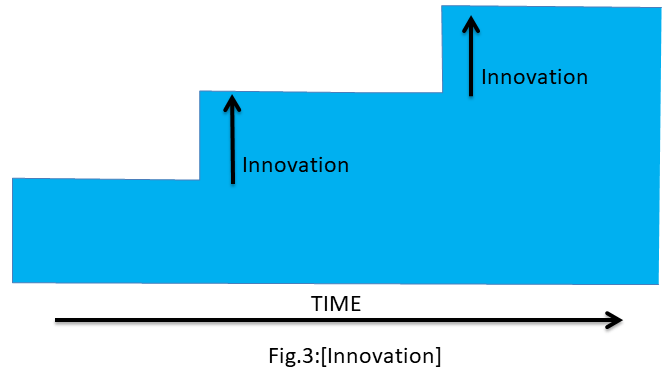
The organization has only innovation-oriented products that would cost more. Because the transformation of technology will cost high.

Kaizen vs Innovation

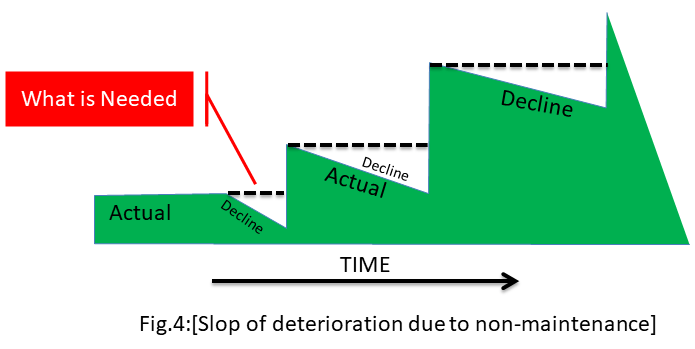
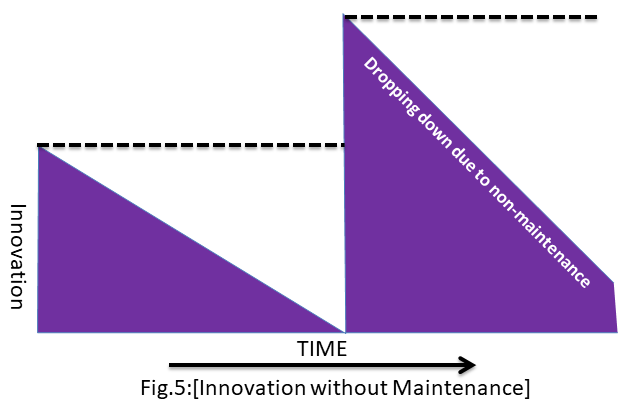
Only innovation-oriented organizations may often face the above situation (Decline) due to non-maintenance. So we have to sustain the new standard of innovation to prevent the declining situation.

Innovation without maintenance:

Kaizen vs Innovation

Key Differences Between Kaizen and Innovation:

KAIZEN:
Elements of Comparison Kaizen
Approach More often collective, team Effort, and System oriented.
Method More often collective, Team Effort, and System oriented.
Idea Generation Flow from experience and Knowledge.
Involvement Through People
Maintenance Effort Whether effort put into process improvement gives better results.
Impact Long Term and Long Lasting.
Participation & Involvements Everybody.
Evaluation Whether effort put in process improvement gives better results.
Advantage Very well suitable for a slow-growth economy.
Effect Long term  and continuous but undramatic
Speed Small Steps
Timeframe Continuous and Rising
Changes of success Always on a high level.
Motto Preservation & Improvement
INNOVATION:
Elements of Comparison Innovation
Approach An Aggressive individual likes efforts from an individual.
Method Drastic Change of existing methods by discarding i.e. Creating a new process.
Idea Generation New Investment, Technology Transformation, R&D.
Involvement Investment in Equipment, Technology
Maintenance Effort Through technology
Impact Short -but dramatic change, yielding short-term gains.
Participation & Involvements Select a few.
Evaluation Whether Efforts put in results in profit.
Advantage Fast-growing economic.
Effect Short term but dramatic.
Speed Big Steps
Timeframe Interrupted and limited.
Changes of success Unsettled
Motto Reconstruction

Useful Articles:

Quality Template
DOWNLOAD

Thank you for Reading…. Keep visiting Techiequality.com

If you require any further information, let me know.

Popular Post:

Implementation of KAIZEN in Industry

Implementation of KAIZEN in Industry

Implementation of KAIZEN in Industry:

Implementation of KAIZEN in Industry is the most important key to the Industry for Continuous Improvement in any type of Loss or Waste. But the sustaining of any type of kaizen is the question mark for the industry. Many industries try their best to implement the kaizen at the initial stage is become successful. but sustaining the continuous improvement program is very difficult. Kaizen is the Key Input to all types of Business system standards. We will discuss here details about the comprehensive steps of the KAIZEN implementation program and its Sustainability.

Download the KAIZEN report template or format.

Step-1: Identify the Big Losses or Wastage in process or Areas

Based on the Historical data you have to select the higher contribution losses among the sets of different types of Losses in a particular process where you would like to Improve. Basically, the Pareto chart you can use to identify the Loss contribution among the sets of losses.

Step-2 Formation of Team

It is the same as what generally all types of project teams are made. The Process or Section In-charge will be the leader of the Kaizen Project.  and other team members should be from different functions such as production, quality, development, maintenance, etc. Now leader will give contributions to clarify the individual roles and responsibilities of each and every member. Responsibility and Activity Matrix need to be prepared before going to the next step. Here is one example of an Activity matrix.

Activity Matrix of Kaizen:

Activity Matrix is the helping tool for the successful Implementation of KAIZEN in Industry Download Activity Matrix of Kaizen.

Step-3 Collection of Data

Before collecting data, you have to identify the potential cause of the problem. Data need to be collected for a better understanding of the correlation between potential causes and problems.

Step-4 Analysis

This step is the most important step for action. Here you have to do a why-why analysis. And need to follow the narrow steps of Brainstorming to identify the Root cause through the involvement of each individual member of the team.

Step-5 Implementation of Project

Here aforesaid Kaizen Activity Matrix needs to be executed for the successful implementation of the Project or you can also be laid down the milestone chart or Gantt chart for the implementation of the project. During the Project implementation budget needs to be considered.

Step-6 Achievement of Kaizen Goal

Check up on the result of kaizen and also effectiveness. Address the Tangible and Intangible benefits.

Step-7 Standardization

The job is not over yet.  here you have to prepare the SOP, Fill up the Kaizen template, need to impart awareness about Kaizen’s benefits, etc. This will call for making those a working system.  Horizontal deployment over a similar area will give you the strength of the organization as cumulative tangible and intangible benefits.

Step-8 Sustenance

In step Sustenance, Sustainability Kaizen audit on a minimum monthly basis needs to be carried out.

Kaizen Examples:

as you know Kaizen is the best practice in the manufacturing industries for continuous improvement. I am sharing here my own experience that how I was identifying the kaizen idea in several operational areas.

when I was involved in shop floor manufacturing activities, every day on the morning shift I was analyzing the line rejection with details cause, and periodically did the Q component inspection. after doing the analysis and several types of Gemba auditing, finally, I was preparing problems identified report w.r.t man, machine, methods, material, and other factors for kaizen idea / continuous improvement purpose. discussed all problems related to the concerns department and collected their suggestions/improvement points. Given below is the kaizen methodology that you can follow to implement kaizen in your work zone.

  • List out the current problems, and issues in your work areas.
  • Find out the opportunities.
  • Categories the problems and find out which one is fit for Kaizen.
  • Do the Why-Why analysis.
  • Find out the Root causes
  • Take the Action Plan (CAPA).
  • Implement the action plan
  • Monitor the effectiveness.
  • Standardize the document
  • Visualize the data, SOP, OPL, etc.
  • Calculate the cost savings.
  • Do the periodic Kaizen sustenance audit to know the actual status or function of Kaizen.
ObjectivesHelping tools/techniques/methods for kaizen
KaizenTo eliminate waste, optimize productivity, and achieve continuous improvement.Engineering changes, Poka-yoke, SOP, OPL, PDCA, SDCA, Lean QC, QC, DMAIC, etc.

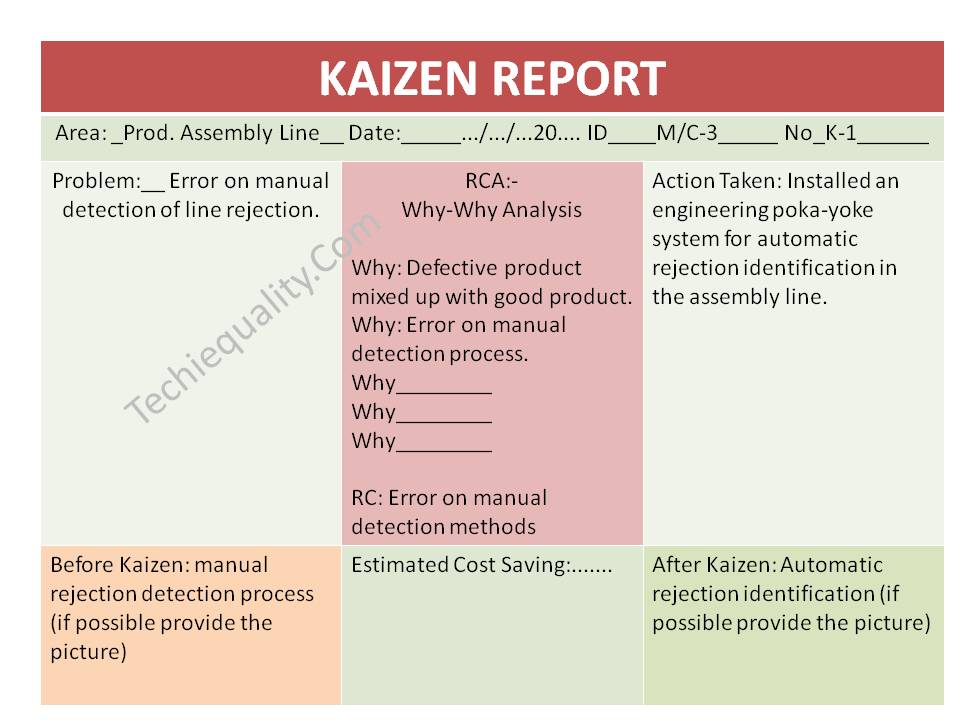
For kaizen examples, let’s say a company has a manual process for line rejection identification in the product assembly line, The engineering team developed a Kaizen idean and installed an engineering poka-yoke system for automatic rejection identification in the assembly line. we have prepared the same in the kaizen report, which is given below;

kaizen examples

Kaizen Template:

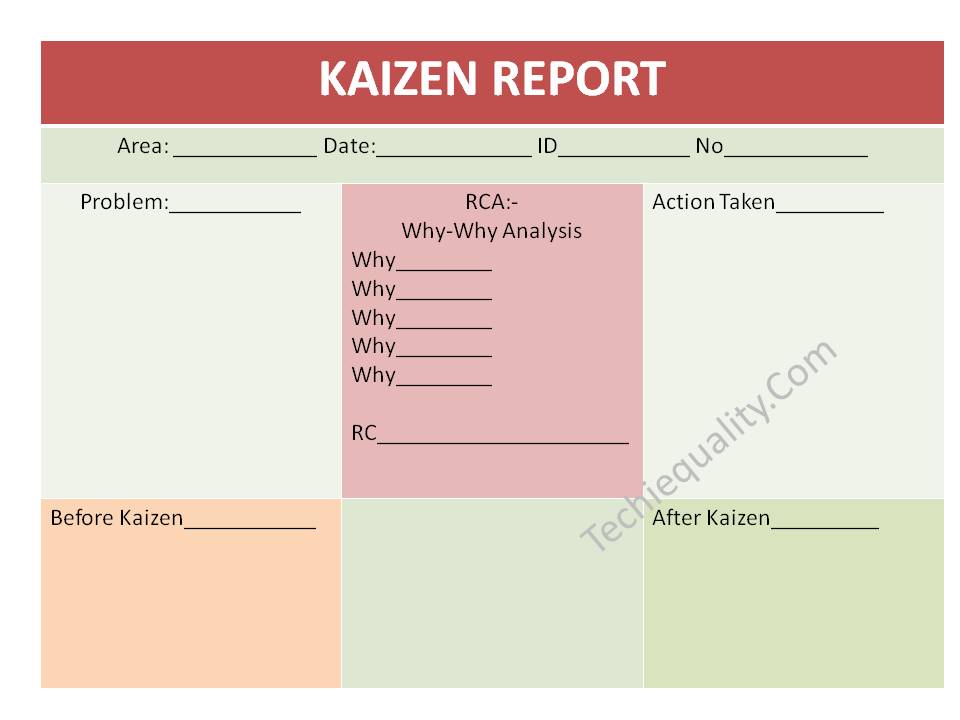
Below kaizen template is very simple to understand and easy to implement. this kaizen sheet has very simple nomenclature, those are normally used in manufacturing industries. for a better understanding, you can refer to the above filled-up kaizen sheet/ report.

kaizen template

Kaizen Sustenance Checking Methods:

Implementation of kaizen is important but sustenance of the kaizen is very important, so you can follow the below steps to check the sustenance of kaizen.

  • List out the monthly kaizen for your work zone.
  • create a Team.
  • Do at least half yearly kaizen sustenance audit
  • If possible then, link the kaizen with the daily manufacturing operation check sheet.
  • Incorporate the kaizen-poka yoke in the control plan and do the periodic test.

Thank you so much for visiting Techiequality.com

Popular Post: