How to measure process capability (Cp & Cpk)? Download Excel Template
Hello readers! Today we will discuss how to measure process capability (Cp & Cpk). As you know that process capability and its index can be measured by using an Excel template or by using software like Minitab etc. We are offering to our readers for a limited time period to download the approved excel format, so download the template from the below link.
DOWNLOAD Excel Template of Cp & Cpk.
Process Capability (Cp):
- Process Capability (Cp) is a statistical measurement of a process’s ability to produce parts within specified limits on a consistent basis
- It gives us an idea of the width of the Bell curve.
- The Process Capability for a stable process is typically defined as ((USL-LSL)/ (6 x Standard Deviation)).
Process Capability Index (Cpk):
- It shows how closely a process is able to produce the output to its overall specifications
- More Value of Cpk means more process capable.
- Cpk value <1 means the bell curve will be out of USL/LSL
- Common Cpk vale=1,1.33,1.67 & 2
- The Cpk value of a start-up manufacturing organization is supposed to be 1.33.
- The Process Capability Index for a stable process is typically defined as the minimum of CPU or CPL
How to measure process capability (Cp & Cpk)? (Industrial Example):
| Characteristics | Green Sand Permeability |
| Process: | Green sand moulding process |
| USL | 200 |
| LSL | 180 |
Table-A
| Sl.No. | 1 | 2 | 3 | 4 | 5 | 6 | 7 | 8 | 9 | 10 |
| Subgroup1 | 190.00 | 189.00 | 189.00 | 191.00 | 190.00 | 192.00 | 188.00 | 191.00 | 189.00 | 189.00 |
| SG2 | 191.00 | 188.00 | 188.00 | 191.00 | 191.00 | 193.00 | 187.00 | 191.00 | 188.00 | 188.00 |
| Subgroup3 | 192.00 | 190.00 | 188.00 | 192.00 | 192.00 | 189.00 | 189.00 | 192.00 | 190.00 | 188.00 |
| SG4 | 192.00 | 188.00 | 189.00 | 189.00 | 192.00 | 190.00 | 189.00 | 189.00 | 188.00 | 189.00 |
| Subgroup5 | 193.00 | 189.00 | 190.00 | 190.00 | 193.00 | 188.00 | 190.00 | 190.00 | 189.00 | 190.00 |
| Mean | 191.60 | 188.80 | 188.80 | 190.60 | 191.60 | 190.40 | 188.60 | 190.60 | 188.80 | 188.80 |
| Max | 193.00 | 190.00 | 190.00 | 192.00 | 193.00 | 193.00 | 190.00 | 192.00 | 190.00 | 190.00 |
| Min | 190.00 | 188.00 | 188.00 | 189.00 | 190.00 | 188.00 | 187.00 | 189.00 | 188.00 | 188.00 |
| Range | 3.00 | 2.00 | 2.00 | 3.00 | 3.00 | 5.00 | 3.00 | 3.00 | 2.00 | 2.00 |
Table-B
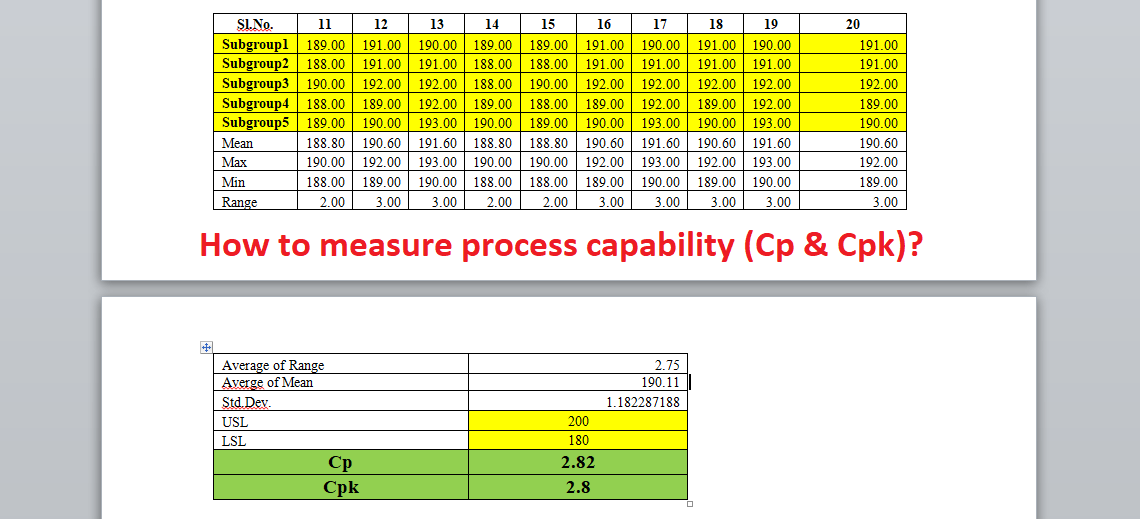
| Sl.No. | 11 | 12 | 13 | 14 | 15 | 16 | 17 | 18 | 19 | 20 |
| Subgroup1 | 189.00 | 191.00 | 190.00 | 189.00 | 189.00 | 191.00 | 190.00 | 191.00 | 190.00 | 191.00 |
| SG2 | 188.00 | 191.00 | 191.00 | 188.00 | 188.00 | 191.00 | 191.00 | 191.00 | 191.00 | 191.00 |
| Subgroup3 | 190.00 | 192.00 | 192.00 | 188.00 | 190.00 | 192.00 | 192.00 | 192.00 | 192.00 | 192.00 |
| SG4 | 188.00 | 189.00 | 192.00 | 189.00 | 188.00 | 189.00 | 192.00 | 189.00 | 192.00 | 189.00 |
| Subgroup5 | 189.00 | 190.00 | 193.00 | 190.00 | 189.00 | 190.00 | 193.00 | 190.00 | 193.00 | 190.00 |
| Mean | 188.80 | 190.60 | 191.60 | 188.80 | 188.80 | 190.60 | 191.60 | 190.60 | 191.60 | 190.60 |
| Max | 190.00 | 192.00 | 193.00 | 190.00 | 190.00 | 192.00 | 193.00 | 192.00 | 193.00 | 192.00 |
| Min | 188.00 | 189.00 | 190.00 | 188.00 | 188.00 | 189.00 | 190.00 | 189.00 | 190.00 | 189.00 |
| Range | 2.00 | 3.00 | 3.00 | 2.00 | 2.00 | 3.00 | 3.00 | 3.00 | 3.00 | 3.00 |
| Average of Range | 2.75 |
| Averge of Mean | 190.11 |
| Std.Dev. | 1.182287188 |
| USL | 200 |
| LSL | 180 |
| Cp | 2.82 |
| Cpk | 2.8 |
To know more about the manual calculation then click-here.
Similar Post:
How to calculate Cp and Cpk? |Practical Case Study | Process Capability Example
How to measure process performance (Pp & Ppk)?
Process Performance Example (Pp) & Ppk |Download Format
How to calculate process performance (Pp & Ppk)?
Process Performance (Pp) & Ppk Excel Template |DOWNLOAD


Thank you for reading….Keep visiting Techiequality.Com
Popular Post

Shanti Gopal Pradhan is an experienced professional in Quality Management Systems, QA, Operations, Business Excellence, and Process Improvement. He has strong expertise in international standards including IATF 16949, ISO 9001, ISO 14001, ISO 45001, and ISO 17025, along with methodologies such as TQM, TPM, and Six Sigma.
He holds a degree in Mechanical Engineering along with an MBA, combining strong technical acumen with strategic business insight, he is a Certified Internal Auditor, Lead Auditor, and Six Sigma Black Belt, with a proven track record in driving quality transformation and operational excellence.