Histogram Template with example | Download
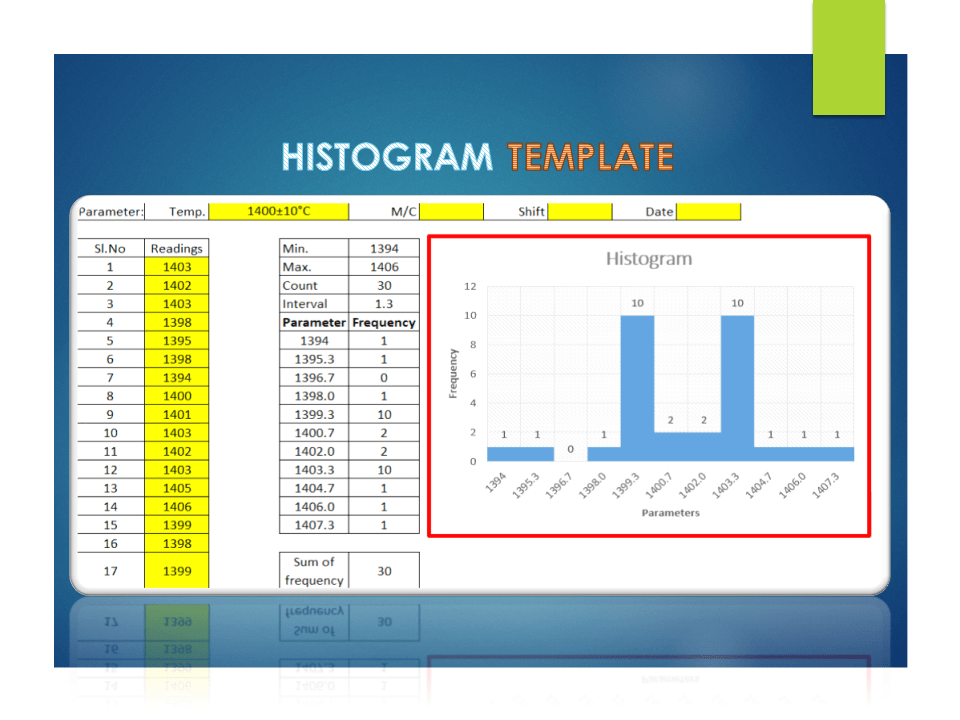
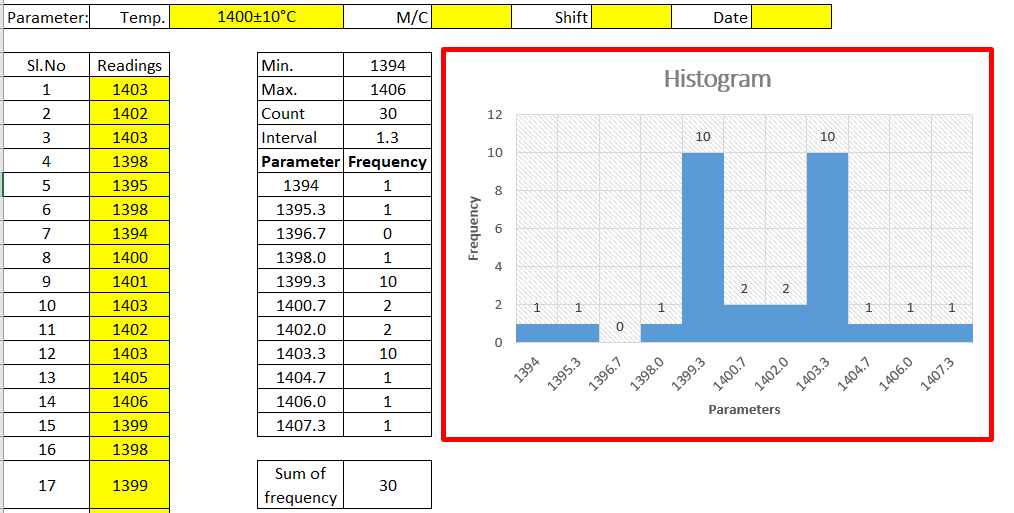
The Histogram Template is prepared in a simple format with an industrial example. We have described the example in below, just go through this article and Download the Template / Format. It’s a very useful tool and is frequently used in manufacturing industries. The main function is to know the frequency distribution, symmetry, and skewness, and it also helps to determine the normality of data by drawing the bell curve.
DOWNLOAD [Histogram Template in Excel format].
Basic Information on Histogram:
A histogram is one of the 7QC tools and commonly used graph to show frequency distribution. Helps summarize data from a process that has been collected over a period of time.
A histogram is a representation of the frequency distribution of numerical data. it was first familiarized by Karl Pearson. A histogram is related to merely one type of variable data. You should calculate the interval value to represent the bins. Bins shall give an idea about the how much data falls within the selected data range’s width. Histogram gives the indication about data distribution as normal, skewed, or bi-modal.
How to use our Histogram Template:
Step-1: Download the Histogram Template from the above link.
Step-2: Carefully read the “Note” mentioned in the Excel template.
Step-3: Enter the reading only in the yellow color box. Then other values will calculate automatically and your histogram will be ready for interpretation.
Note:
1. Only yellow colour boxes are changeable
2. Make sure that the sum of frequency is equal to the total count, e.g. sum of frequency in a given example [example is given in histogram excel format, just download and see the example] is 30 and the count is also 30, if not then you have to adjust the parameters and frequency table in frequency distribution format for doing so click on the link given “How to adjust parameters and frequency table in Histogram Template?”.
Useful Links:
How to Plot Pareto Chart in Excel ( with example)
Corrective and Preventive Action Format | CAPA with Example.
OEE Calculation-How To Calculate OEE (Overall Equipment Effectiveness) with Example
Implementation of KAIZEN in Industry


Thank you for reading…. Keep visiting Techiequality.Com
Let us know if you have any questions…and drop your comments below.
Popular Post:

Shanti Gopal Pradhan is an experienced professional in Quality Management Systems, QA, Operations, Business Excellence, and Process Improvement. He has strong expertise in international standards including IATF 16949, ISO 9001, ISO 14001, ISO 45001, and ISO 17025, along with methodologies such as TQM, TPM, and Six Sigma.
He holds a degree in Mechanical Engineering along with an MBA, combining strong technical acumen with strategic business insight, he is a Certified Internal Auditor, Lead Auditor, and Six Sigma Black Belt, with a proven track record in driving quality transformation and operational excellence.