MTBF and MTTR Template, Format, Calculation | Manufacturing Example:
What is MTBF?
Hi, readers in this article we will be covering both MTBF and MTTR calculation with a manufacturing example. So read carefully, learn the concept, and implement it in your organization. Mean time between failures (MTBF) is the arithmetic average time between failures. It helps to measure the performance of a machine or assets. In manufacturing industries, we are always worried about the breakdown of machine or equipment failure, which can make a large loss and ultimately increase the downtime (Stop time) of the machine. Uptime is a big factor to enhance productivity. The higher the MTBF means the machine runs a long time before failing.
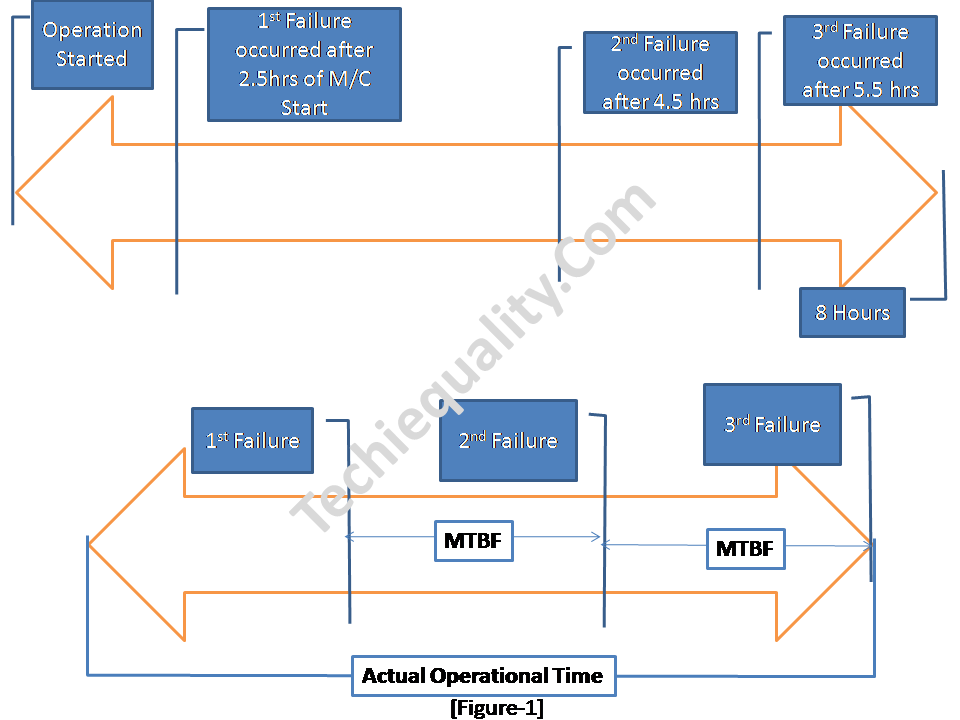
As you can see in the above figure operation has stopped after 8 hours of duration but meanwhile, three failures have occurred. Due to this failure machine was stopped for maintenance. In this case, 8 hours was the available operational time but 6 hours was the total running time. Considering all the above data, the MTBF value is 2 hours. It means the average time between 1st failure & 2nd failure or 2nd failure & 3rd failure is 2 hours. In the manufacturing industry, there are multiple operations and several machines are being used for production. So during the calculation of MTBF, you have to think about multiple factors.
DOWNLOAD– Template of MTBF and MTTR. (mttr, mtbf formula excel)
MTBF Formula:
The total operational time or total run time divided by the total number of failures.
MTBF= (Total Operational Time ÷ Total Number of Failures)
Calculation of MTBF (Mean Time Between Failures):
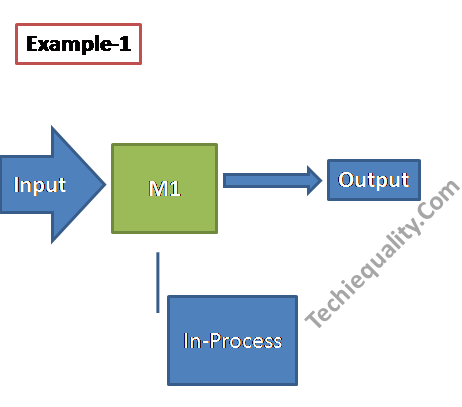
Let, for example, a product “XYZ” has manufactured in a simple method by using a single machine [see the below figure]. This machine runs three shifts per day with monthly 26 working days. But in last month’s operation, the maintenance person had booked the machine’s total number of failures (Breakdown) was 5. And total break-down time was 3 hours. According to all the above data, Monthly MTBF has been calculated and mentioned below;
MTBF = Total operational time ÷ Total number of failures
Total operational time (Run time):
= Planned production time – Stop time
(624 hours – Stop time)
= (624- 81), here stop time included the lunch time, dinner time, tea time, breakdown time, tool changeovers time)
=543 hours
Now, the Total Operational Time of last month = 543 hours, Total number of failures of last month =5 times.
MTBF of last month = (543÷5) hours
=108.6 hours
Similarly, we have calculated the MTBF of a complex process having multiple numbers of machines.
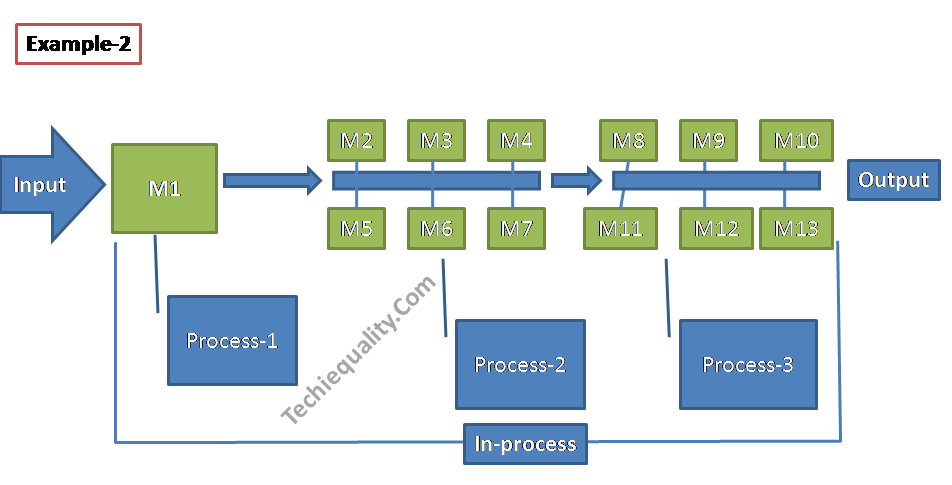
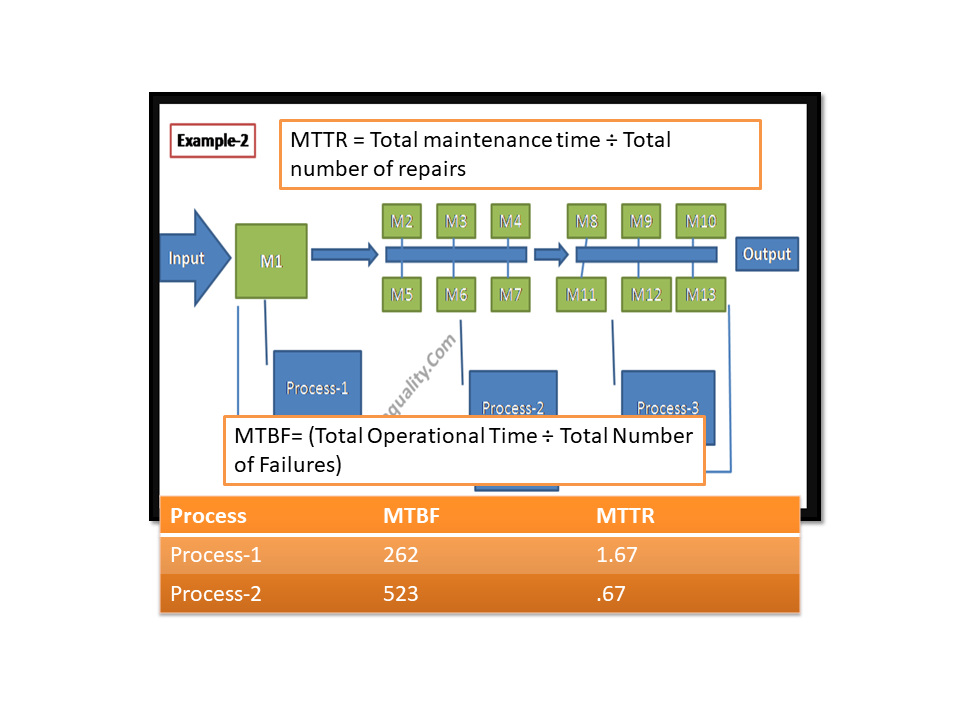
In example 2, all 13 machines run together to produce a product. There is a total of three sub-process i.e. process-1, 2 &3. And process-1 has 1 machine and process-2 &3 have 6 machines each. First of all, we will calculate the MTBF value of each process and then the overall process. Details of data like a machine running time, failure frequency, etc. are given below,
MTBF of Last month:
Total Operation Shift = A, B, C (3 shifts).
Total Number of Machines = 13
Working days of last month = 25 days
Total Number of failures (B/D) =12 times [process-1 =2, process-2 =6, process-3 =4]
Total breakdown time = 10 hours [process-1 =1, process-2 =8, process-3 =1]
Stop time of each machine per day due to Lunch, Dinner, and tea = 3 hours
MTBF of Process-1:
MTBF = Total operational time ÷ Total number of failures
Total operational time (Run time):
= Planned production time – Stop time
(600 hours – Stop time)
= (600- 76)
=524 hours.
Now, Total Operational Time of last month = 524 hours, Total number of failures of last month = 2 times.
MTBF of last month = (524÷2) hours
=262 hours
MTBF of Process-2:
MTBF = Total operational time ÷ Total number of failures
Total operational time (Run time):
= Planned production time – Stop time
(3600 hours – Stop time)
= (3600- 458)
=3142 hours
Now, Total Operational Time of last month = 3142 hours, Total number of failures of last month = 6 times.
MTBF of last month = (3142÷6) hours
=523.666 hours
MTBF of Process-3:
MTBF = Total operational time ÷ Total number of failures
Total operational time (Run time):
= Planned production time – Stop time
(3600 hours – Stop time)
= (3600- 451)
=3149 hours
Now, Total Operational Time of last month = 3149 hours, Total number of failures of last month = 4 times.
MTBF of last month = (3149÷4) hours
=787.25 hours
MTBF of Overall process: = {(262 + 523.666 + 787.25) ÷3}
=524.305 hours
| Process | MTBF in hours |
| Process-1 | 262 |
| Process-2 | 523.67 |
| Process-3 | 787.25 |
| Overall Process | 524.305 |
What is MTTR?
It is the average time required to correct and repair a failed component or equipment or device to put it in working order. It reflects how much average time is spent to correct or repair the component.
MTTR Formula:
Total maintenance time or total B/D time divided by the total number of failures.
MTTR = Total maintenance time ÷ Total number of repairs.
MTTR Calculation (Mean time to repair):
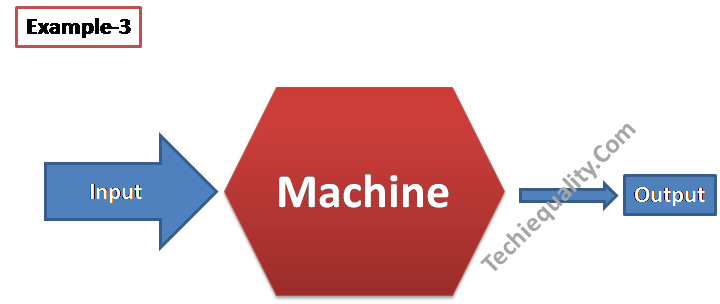
Example-3.
It’s a simple manufacturing process consisting of a single machine. In last month 3 times machine was stopped due to breakdown & the total breakdown or repair time was 2 hours. So here we are going to calculate the MTTR, details of the calculation are given below.
MTTR = Total maintenance time ÷ Total number of repairs.
= (2 ÷ 3)
= 0.67 hours
Example-4:
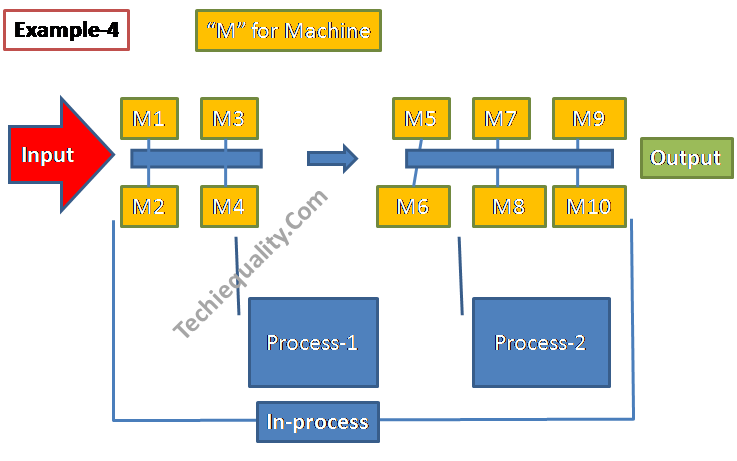
In Example-4, the whole process is covered by the two sub-process i.e. process-1 and process-2. In first sub-process has a total of 4 machines and similarly, the second process has a total of 6 machines in operation. All data related to breakdown and frequency of failure are given in below table;
| Process | Breakdown or Maintenance time | Frequency of failure or total number of repairs |
| Process-1 | 5 hours | 3 |
| Process-2 | 4 hours | 6 |
MTTR of Process-1: 1.67 hours
MTTR of Process-2: 0.67 hours
Overall process MTTR = (1.67 + 0.67) ÷2
=1.17 hours
| Process | MTTR in Hours |
| Process-1 | 1.67 |
| Process-2 | 0.67 |
| Overall Process | 1.17 |
Why MTBF and MTTR are important for manufacturing industries?
MTTR indicates the efficiency of corrective action of machine failure and similarly
MTBF indicates the average machine run time between failures.
Monitoring both indicators can give the idea to control your maintenance method and indicate the opportunity for improvement in the same field. You can easily identify the training needed for your maintenance personnel after analyzing the values. You can also categorize the production loss w.r.t breakdown time.
What is the requirement of IATF 16949 w.r.t MTBF and MTTR?
As per the standard requirement, an organization shall document the maintenance objectives, for example, the objective of MTTR and MTBF.
How do you calculate MTBF and MTTR?
We have calculated the MTBF and MTTR with a manufacturing example, please read the above example.
What is the MTTR formula?
MTTR = Total maintenance time ÷ Total number of repairs.
How do you calculate MTBF?
MTBF= (Total Operational Time ÷ Total Number of Failures)
How to reduce the MTTR hours and How to increase the MTBF hours?
For improving both the parameters, we have to keep the focus on below things, like
- Plan and execute preventive maintenance.
- Plan and execute the predictive maintenance.
- Reduce the breakdown time and frequency.
- optimize the operation time.
- Rank the machines and monitor the health of machines and equipment.
- Do the periodic CLIT (Cleaning, Lubrication, Inspection, and tightening).
- Do the Kaizen on machines.
- provide the training to the maintenance team.
- Display the OPL for the machine operators for a better understanding of the machine’s operation.
- Visual marking on the machine and introducing the poka-yoke
The above points are not limited to the given list but you can do more best practices to improve the MTTR and MTBF.
Free Templates / Formats of QM: we have published some free templates or formats related to Quality Management with manufacturing / industrial practical examples for better understanding and learning. if you have not yet read these free template articles/posts then, you could visit our “Template/Format” section. Thanks for reading…keep visiting techiequality.com
Useful Post:
Types of Fishbone Diagram |Dispersion Analysis |Enumeration |Process Classification
Dispersion Analysis Cause & Effect Diagram Template |Download Excel Format
Strategies for Manufacturing Process Improvement |11+ Strategies
More on TECHIEQUALITY


Popular Post:

Shanti Gopal Pradhan is an experienced professional in Quality Management Systems, QA, Operations, Business Excellence, and Process Improvement. He has strong expertise in international standards including IATF 16949, ISO 9001, ISO 14001, ISO 45001, and ISO 17025, along with methodologies such as TQM, TPM, and Six Sigma.
He holds a degree in Mechanical Engineering along with an MBA, combining strong technical acumen with strategic business insight, he is a Certified Internal Auditor, Lead Auditor, and Six Sigma Black Belt, with a proven track record in driving quality transformation and operational excellence.