Process Capability Analysis | Cp & Cpk Calculation Excel Sheet with Example
Process Capability Analysis: – The Process Capability (Cp) and Process Capability Index (Cpk) are the important tools, which give an Idea about the Process Capability of a Stable Process. Here we will discuss on Calculation of Cp and Cpk with Examples. We are offering here Process Capability Excel Template / Format for you, hence click on the below links to Download the Excel Format.
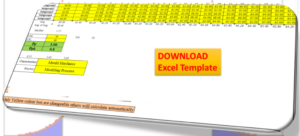
DOWNLOAD (Cp & Cpk Excel Template / Format-Sample copy)
Process Capability (Cp):
- Process Capability (Cp) is a statistical measurement of a process’s ability to produce parts within specified limits on a consistent basis
- It gives us an idea about the width of the Bell curve.
- The Process Capability for a stable process is typically defined as ((USL-LSL)/ (6 x Standard Deviation)).
Cpk-Process Capability Index :
- It shows how closely a process is able to produce the output to its overall specifications.
- More Value of Cpk means more process capable.
- The Process Capability Index for a stable process is typically defined as the minimum of CPU or CPL.
Process Capability Analysis:
Industrial Example:
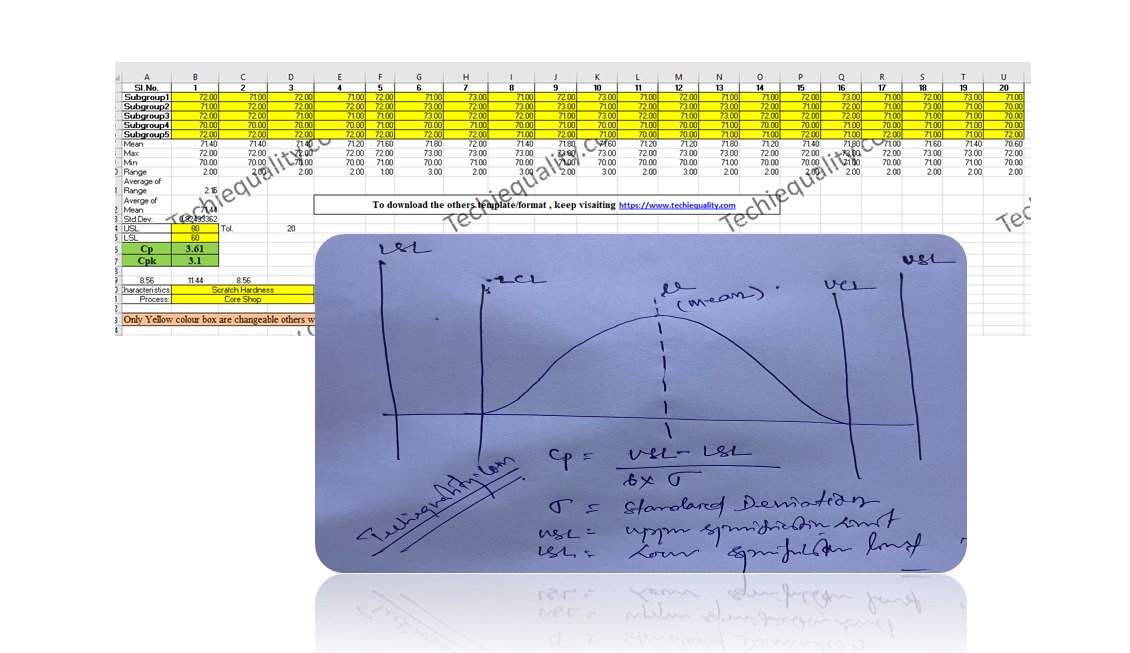
As per the Quality Assurance Plan, The shift engineers of Core Shop have started collecting the readings of the scratch hardness of Core. Given below are the details of Product Characteristics;
Specification of Scratch hardness is 70±10.
The Upper Specification Limit is 80.
The Lower Specification Limit is 60.
Tolerance is 20.
Scratch hardness readings Table:
Table-1
| Sl.No. | 1 | 2 | 3 | 4 | 5 | 6 | 7 | 8 | 9 | 10 |
| SG 1 | 72.00 | 71.00 | 72.00 | 71.00 | 72.00 | 71.00 | 73.00 | 71.00 | 72.00 | 73.00 |
| SG2 | 71.00 | 72.00 | 72.00 | 72.00 | 72.00 | 72.00 | 72.00 | 73.00 | 73.00 | 71.00 |
| SG 3 | 72.00 | 72.00 | 71.00 | 71.00 | 71.00 | 73.00 | 72.00 | 72.00 | 71.00 | 73.00 |
| SG4 | 70.00 | 70.00 | 70.00 | 70.00 | 71.00 | 70.00 | 71.00 | 70.00 | 71.00 | 70.00 |
| SG 5 | 72.00 | 72.00 | 72.00 | 72.00 | 72.00 | 72.00 | 72.00 | 71.00 | 72.00 | 71.00 |
Table-2
| Sl.No. | 11 | 12 | 13 | 14 | 15 | 16 | 17 | 18 | 19 | 20 |
| SG1 | 71.00 | 72.00 | 71.00 | 71.00 | 72.00 | 73.00 | 71.00 | 72.00 | 73.00 | 71.00 |
| SG2 | 72.00 | 73.00 | 73.00 | 72.00 | 71.00 | 72.00 | 71.00 | 73.00 | 71.00 | 70.00 |
| SG3 | 72.00 | 71.00 | 73.00 | 72.00 | 72.00 | 72.00 | 71.00 | 71.00 | 71.00 | 70.00 |
| SG4 | 71.00 | 70.00 | 71.00 | 70.00 | 70.00 | 71.00 | 70.00 | 71.00 | 71.00 | 70.00 |
| SG5 | 70.00 | 70.00 | 71.00 | 71.00 | 72.00 | 71.00 | 72.00 | 71.00 | 71.00 | 72.00 |
In the above two tables (Table-1 &2), we have taken the 100 readings i.e. (20 times X 5 readings at a time).
Range=Maximum Value-Minimum Value
Average of Range=2.15
Value of d2=2.326 (For Subgroup size 5)
USL = 80, LSL = 60.
Standard Deviation:
= Average of Range/d2
2.15/2.326
=0.92
Process Capability (Cp):
= ((USL-LSL)/ (6 x Standard Deviation))
(80-60)/ (6 x 0.92)
20/5.52
= 3.61
Process Capability Index (Cpk):
CPU:
= ((USL-Average of Mean)/3 x Standard Deviation)
(80-71.43)/ (3 x 0.92)
8.57/ 2.76
= 3.10
CPL:
= ((Average of Mean-LSL)/3 x Standard Deviation)
(71.43-60)/ 2.76
10.4211.43/2.76
=4.14
Cpk= 3.10 (minimum of CPU or CPL).
After doing the Process Capability Analysis on Scratch hardness readings, we got the below result value:
| Characteristics: Scratch Hardness |
| Cp (Process Capability) = 3.61 |
| Cpk (Process Capability Index) = 3.10 |
Process Capability Analysis with Manufacturing Example
The process engineer has collected the 100 nos laddle temperature reading and the same is mentioned in the below table.
Laddle Temperature Specification= 600 ± 15°C
USL = 615
LSL = 585
Table-1
| 1 | 2 | 3 | 4 | 5 | 6 | 7 | 8 | 9 | 10 | |
| S1 | 605 | 599 | 610 | 605 | 603 | 604 | 600 | 609 | 605 | 601 |
| S2 | 603 | 601 | 612 | 599 | 601 | 598 | 603 | 610 | 603 | 598 |
| S3 | 604 | 598 | 609 | 610 | 612 | 609 | 605 | 612 | 604 | 603 |
| S4 | 600 | 603 | 605 | 598 | 599 | 610 | 598 | 609 | 600 | 610 |
| S5 | 602 | 602 | 607 | 609 | 605 | 612 | 599 | 605 | 609 | 603 |
| Max. | 605 | 603 | 612 | 610 | 612 | 612 | 605 | 612 | 609 | 610 |
| Min. | 600 | 598 | 605 | 598 | 599 | 598 | 598 | 605 | 600 | 598 |
| Range | 5 | 5 | 7 | 12 | 13 | 14 | 7 | 7 | 9 | 12 |
| Average of Range | 9.85 | |||||||||
| Mean | 602.8 | 600.6 | 608.6 | 604.2 | 604 | 606.6 | 601 | 609 | 604.2 | 603 |
| Average of Mean | 603.92 |
Table-2
| 11 | 12 | 13 | 14 | 15 | 16 | 17 | 18 | 19 | 20 | |
| S1 | 599 | 601 | 602 | 604 | 598 | 598 | 609 | 598 | 600 | 598 |
| S2 | 610 | 598 | 602 | 603 | 603 | 603 | 605 | 603 | 603 | 610 |
| S3 | 598 | 603 | 607 | 598 | 610 | 607 | 612 | 607 | 605 | 598 |
| S4 | 609 | 610 | 609 | 603 | 603 | 598 | 604 | 598 | 607 | 602 |
| S5 | 600 | 603 | 605 | 607 | 598 | 610 | 603 | 610 | 598 | 603 |
| Max. | 610 | 610 | 609 | 607 | 610 | 610 | 612 | 610 | 607 | 610 |
| Min. | 598 | 598 | 602 | 598 | 598 | 598 | 603 | 598 | 598 | 598 |
| Range | 12 | 12 | 7 | 9 | 12 | 12 | 9 | 12 | 9 | 12 |
| Mean | 603.2 | 603 | 605 | 603 | 602.4 | 603.2 | 606.6 | 603.2 | 602.6 | 602.2 |
d2=2.326
Standard Deviation = Average of Range / d2 = 4.23
Cp = (USL-LSL)/6*Standard Deviation = 1.2
CPU = ((USL-Average of Mean)/3 x Standard Deviation) = 0.872
CPL = ((Average of Mean-LSL)/3 x Standard Deviation) = 1.489
CpK = 0.872(minimum of CPU or CPL).
Note: Download the Cp & Cpk excel template or format and deploy it in manufacturing process. downloading links are provided at top of this Article.
QA/QC/TQM/Lean/QMS/6-Sigma Template or Format:


FAQ:
What is the difference between Cp & Cpk?
Ans.: Cp & CpK are termed as process capability and process capability index. In both cases, we would like to verify whether the process can meet the customer’s requirements or not. Generally, it is used when the process is under stable & statically control.
What is the formula of Cp & Cpk?
Cp= ((USL-LSL)/ (6 x Standard Deviation)) , where USL=Upper Specification Limit & LSL=Lower Specification Limit.
Cpk= Minimum of CPU or CPL, where CPU= ((USL-Average of Mean)/3 x Standard Deviation) & CPL= ((Average of Mean-LSL)/3 x Standard Deviation)
What are the good values of Cpk?
Generally, the customers provide the Cpk value to their supplier to maintain it in their manufacturing process. but for your knowledge, a Cpk value of 2 or greater than 2 is an excellent one.
What is cpk?
The cpk is the process capability index which shows how closely a process is able to produce the output to its overall specifications.
What is the IATF 16949 requirement of Statistical Concepts or SPC?
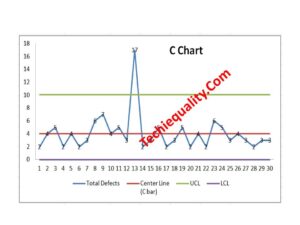
Application of statistical concepts in the IATF 16949 standard has been mentioned in Clause no-9.1.1.3, both Control chart (variable and Attribute) and process capability are the mandatory requirements. The application of statistical concepts shall be understood and used by the employees involved. We have published a separate article on Control Charts for our readers and you can Download Control Chart Excel Template / Format.
More on TECHIEQUALITY


Shanti Gopal Pradhan is an experienced professional in Quality Management Systems, QA, Operations, Business Excellence, and Process Improvement. He has strong expertise in international standards including IATF 16949, ISO 9001, ISO 14001, ISO 45001, and ISO 17025, along with methodologies such as TQM, TPM, and Six Sigma.
He holds a degree in Mechanical Engineering along with an MBA, combining strong technical acumen with strategic business insight, he is a Certified Internal Auditor, Lead Auditor, and Six Sigma Black Belt, with a proven track record in driving quality transformation and operational excellence.