Minitab Process Capability Free Tutorial |Capability Analysis by Minitab:
Hello! Readers, today we will guide you to learn a new topic as “how to do the Capability Analysis by Minitab18?” as you know that how process capability (Cp, Cpk) is important to know the Process consistency or Stability. To delight and enhance the customer requirement and to get the defect-free product, all critical process’s characteristics capability analysis is supposed to Monitor. Download the Minitab Process Capability free tutorial from below link.
Download Minitab Process Capability Tutorial.
The Customer has generally mentioned the value of Process capability and its index in CSR (Customer Specific requirement or Voice of Customer or Critical to Quality). Even after, Supplier can set their own level of Process capability index value considering with CSR and other requirements. Basically, startup company are set up the value as 1.33 at the
Minitab Process Capability Tutorial (Step by Step guide):
Step-1:
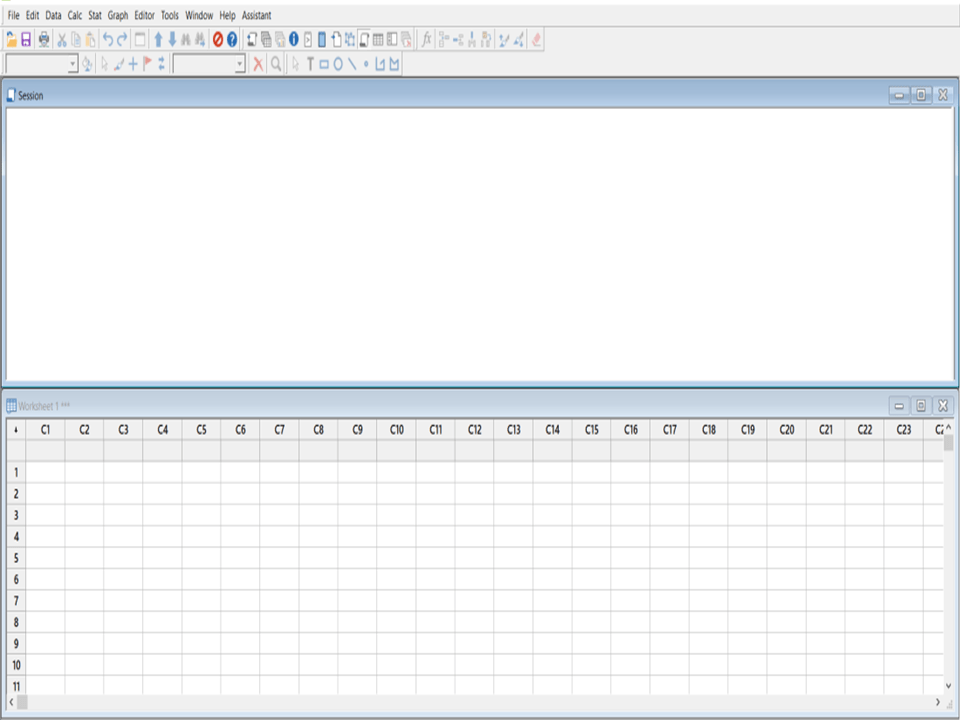
When you will open the Minitab 18, the main screen will appear like below.
Step-2:
let’s get started with an Example, A sheet metal manufacturing company was producing Brake pad. The length of the Brake pad was 150±1mm. After stabilizing the process at “Blanking operation”, Process QC Engineer starts to analysis the Process capability and calculates the Cp & Cpk by using Minitab-18.
We would like to help my all readers to know on How to do Capability Analysis by Minitab 18?
We are having 100 numbers of data readings w.r.t below specifications as;
Subgroup Size=5, Brake pad Length=150±1mm (LSL=149, µ=150, USL=151).
| Date | Observations |
| 12.03.2019 | 149.9 |
| 12.03.2019 | 149.3 |
| 12.03.2019 | 149.5 |
| 12.03.2019 | 149.8 |
| 12.03.2019 | 149.9 |
| 12.03.2019 | 149.8 |
| 12.03.2019 | 149.8 |
| 12.03.2019 | 149.8 |
| 12.03.2019 | 149.7 |
| 12.03.2019 | 150 |
| 12.03.2019 | 150.1 |
……
……
| 13.03.2019 | 149.5 |
| 13.03.2019 | 149.5 |
| 13.03.2019 | 149.8 |
| 13.03.2019 | 150.4 |
| 13.03.2019 | 150.4 |
| 13.03.2019 | 150.3 |
| 13.03.2019 | 150.4 |
| 13.03.2019 | 150.3 |
| 13.03.2019 | 150.3 |
| 13.03.2019 | 150.2 |
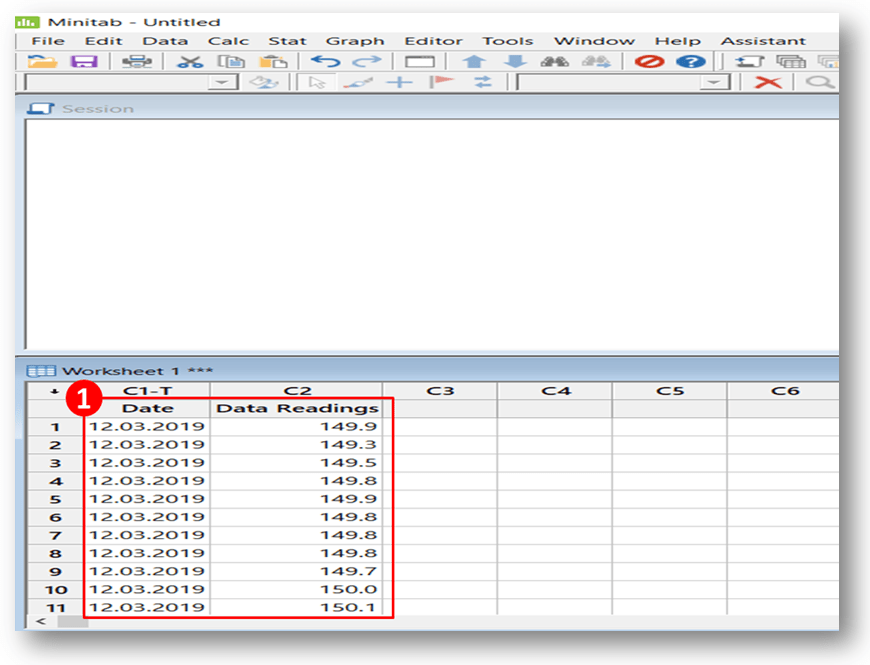
Now, you have to enter all readings in Minitab’s sheet.
Step-3:
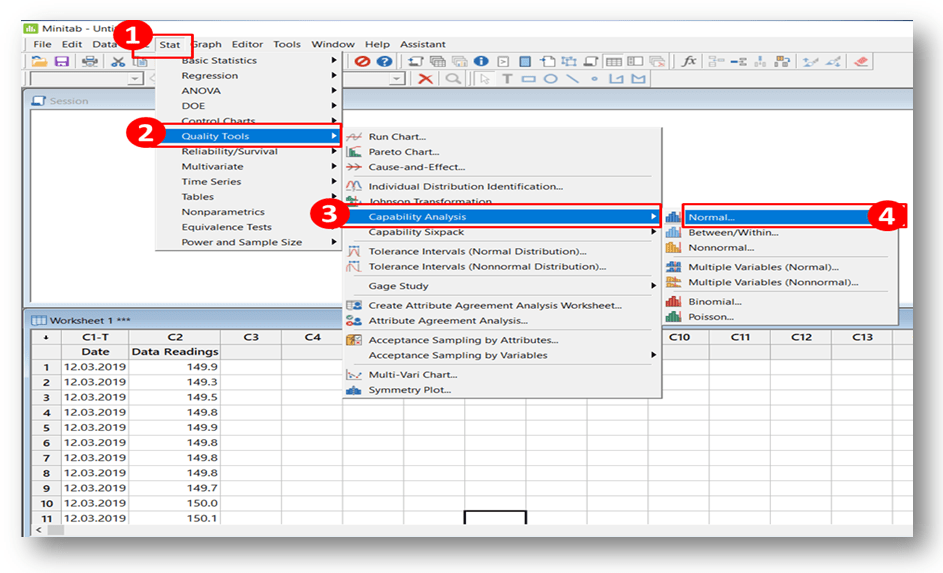
Next, you have to select the capability analysis option from Minitab’s Icon. Just follow the serial number sequence from 1 to 4 as shown in the below fire for selecting the capability analysis option.
[Start>>Quality Tools>>Capability Analysis>>Normal].
Step-4:
After, selecting the Capability Analysis option, a Dialog Box will appear on the screen just like below. Now, you have to set up some value in a
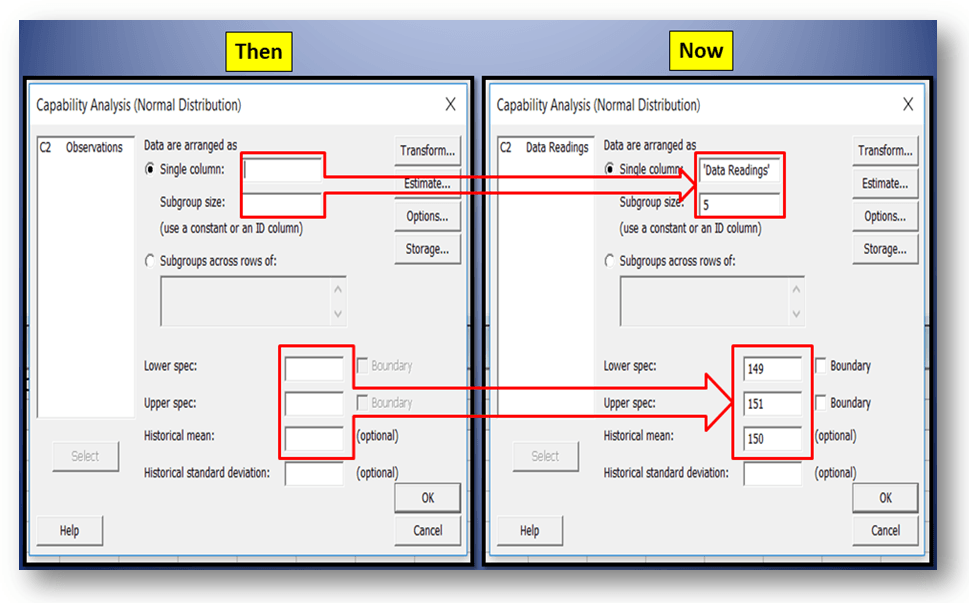
Step-5:
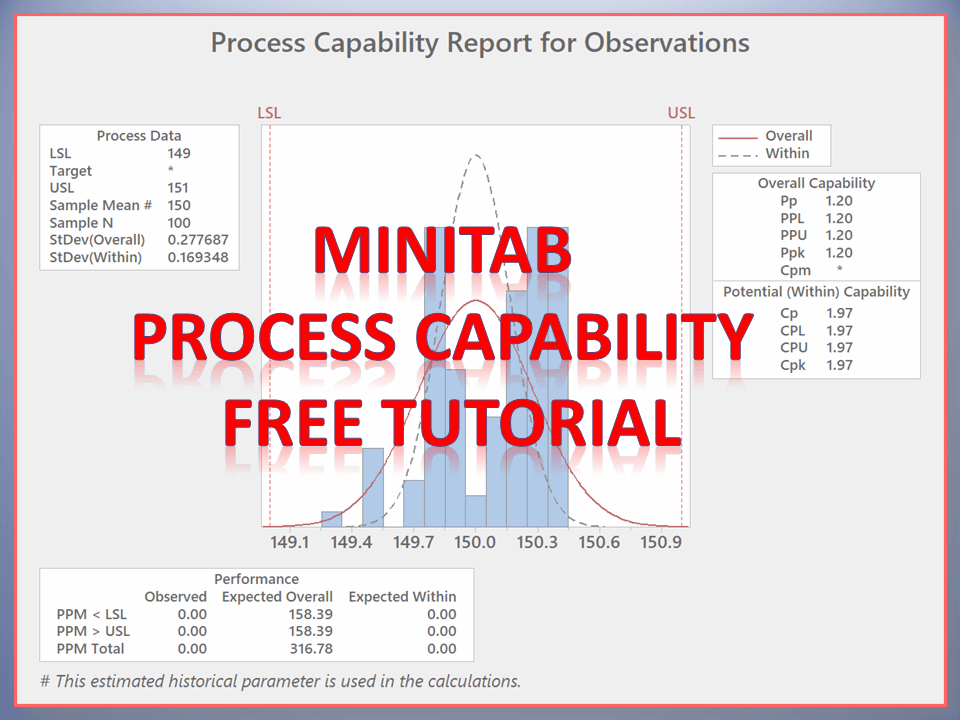
Finally, after selecting the “ok” option in the dialog box, your Process Capability value and the graph will be ready, just like below;
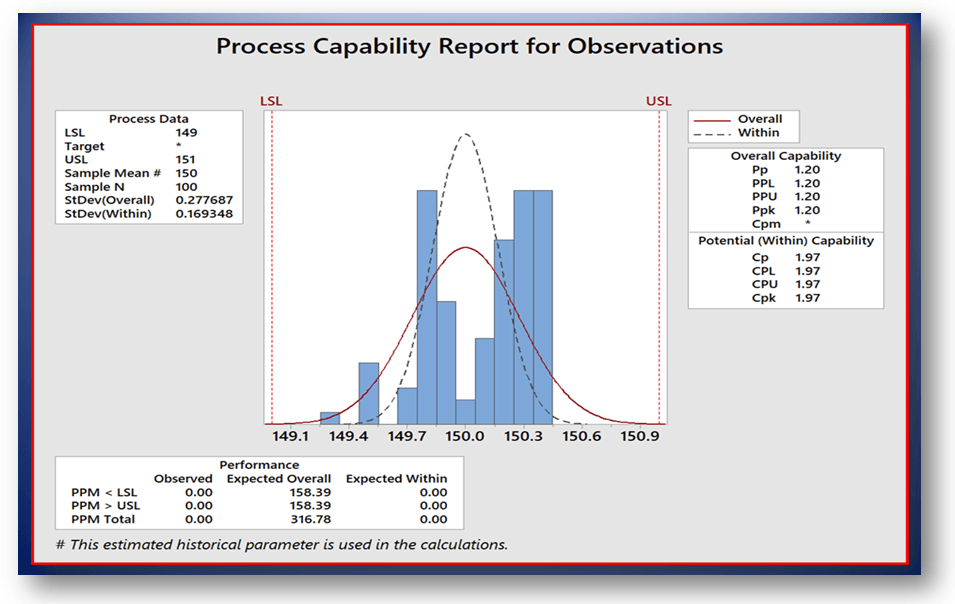
Process capability Report:
Process capability (within), Cp: 1.97
Cpk, Process capability index (within): 1.97
Process Performance (overall), Pp: 1.20
Ppk, Process performance index (overall): 1.20
You could also like to learn about:
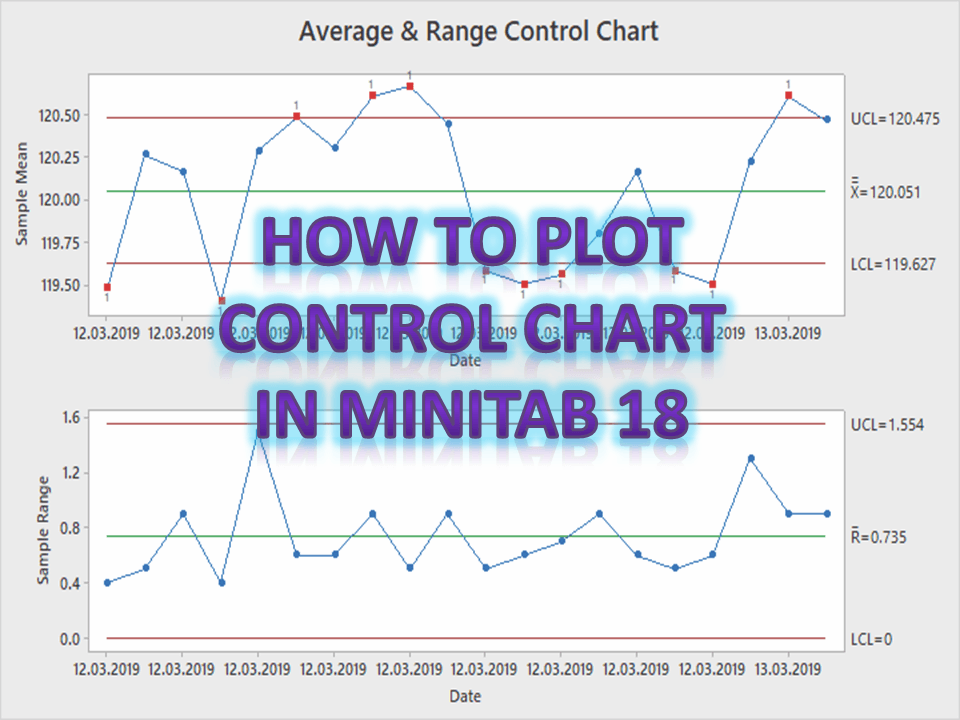
How to Create Control Chart by Minitab-18?
Root Cause Analysis Methodology.
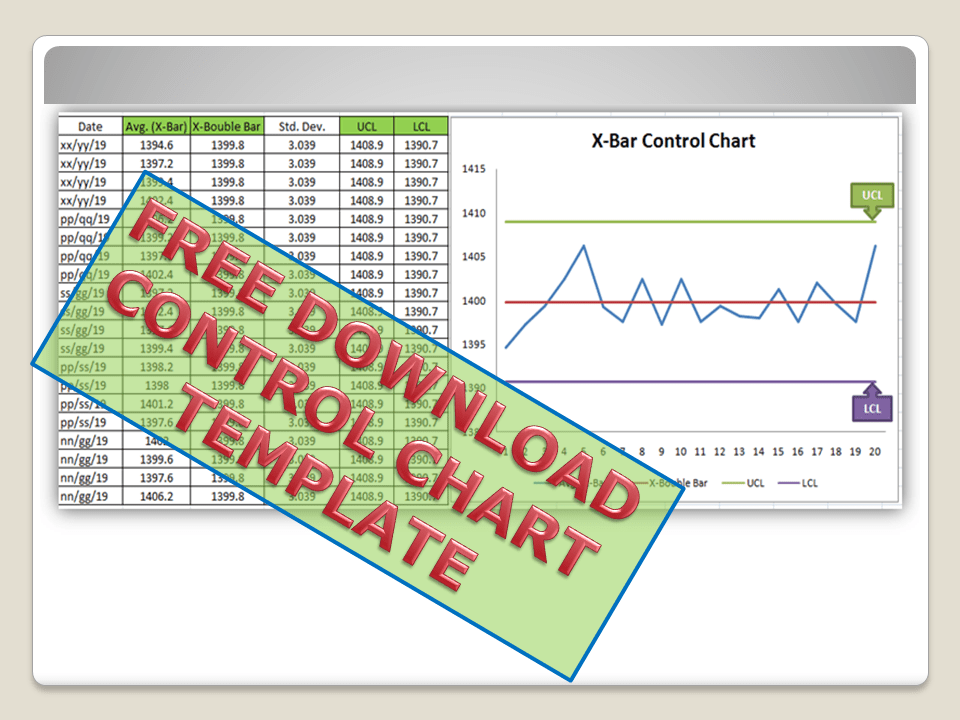
[If you would like to download the several quality Templates, then go to the Download section in below.]
Useful Links:


Thank you for reading…………. Keep visiting Techiequality.Com
Popular Post:

Shanti Gopal Pradhan is an experienced professional in Quality Management Systems, QA, Operations, Business Excellence, and Process Improvement. He has strong expertise in international standards including IATF 16949, ISO 9001, ISO 14001, ISO 45001, and ISO 17025, along with methodologies such as TQM, TPM, and Six Sigma.
He holds a degree in Mechanical Engineering along with an MBA, combining strong technical acumen with strategic business insight, he is a Certified Internal Auditor, Lead Auditor, and Six Sigma Black Belt, with a proven track record in driving quality transformation and operational excellence.