How to calculate z-score in excel with manufacturing example

How to calculate z-score in excel

How to calculate z-score in excel with a manufacturing example:

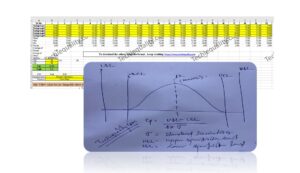
Hi Readers! Here, we are going to learn today how to calculate z-score in excel with manufacturing examples. And also we will understand the standard deviation calculation based on the sample and population. You can download the sample example excel template of z-score calculation from the below link as well.

Sample Excel Template of Z-score-[Free Download]

The formula of Z-Score calculation:

Z-Score = [xi-Mean]/ σ

Where xis the observed value

µ =Mean

σ = Standard deviation of the population.

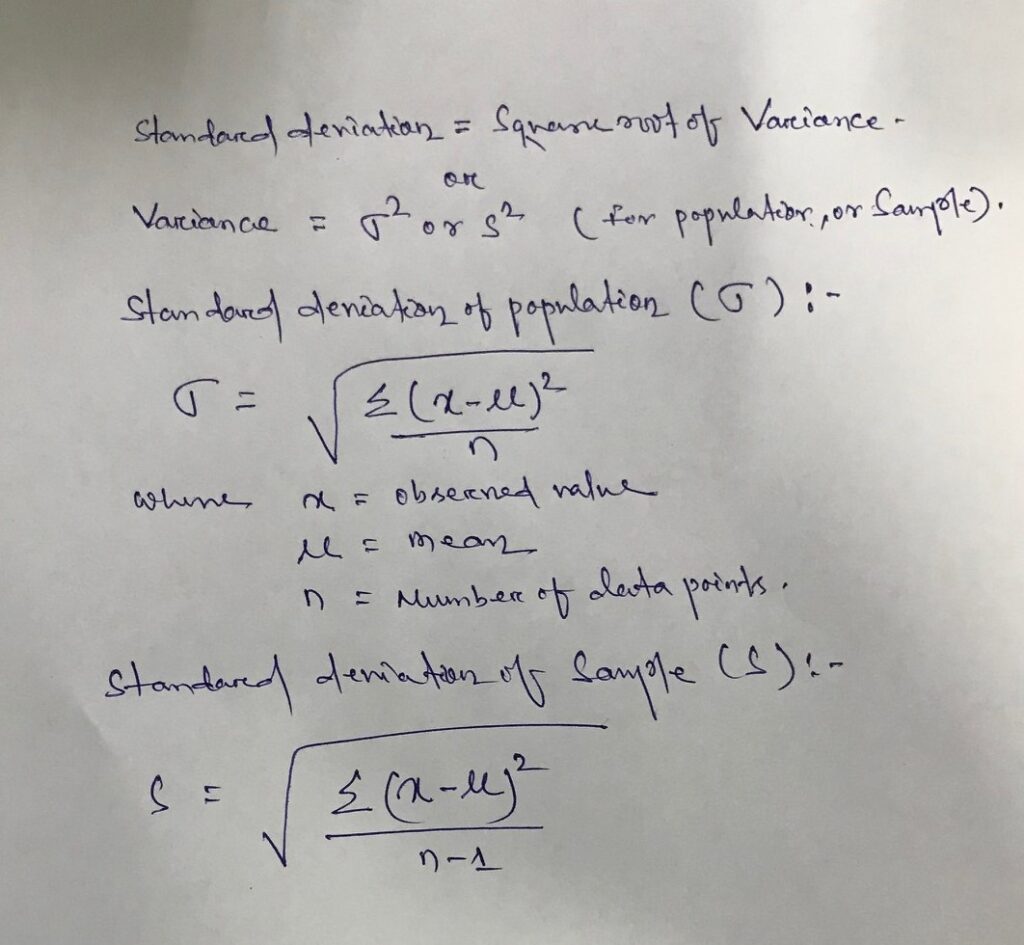
Before starting the calculation, we have to understand the variance and standard deviation of the sample and population, so that very easily we can calculate the value of Z-Score.

Relation between variance and standard deviation:

Standard Deviation is equal to the square root of the variance

σ or s = Square root of the variance

Variance = σ2 or s2
How to calculate z-score in excel

How to calculate z-score in excel with manufacturing example

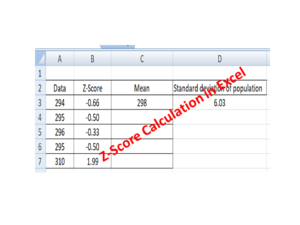
For example, there is a 5 nos total data set that we have observed and these are given below as

Data set = [294, 295, 296, 295, 310], and the company has set the range of -1 to 1 as “not an outlier”. The individual data value which is greater than 1 or less than -1 is the outlier value from the data set.

By using the above formula we are going to calculate the Z-score manually and then by Excel sheet.

Manual calculation of Z-Score:

Data set- = 294, 295, 296, 295, 310.

Z-Score = [xi-Mean]/ σ

Where, X1=294, X2=295, X3=296, X4=295, X5=310

Total number of data points (n) = 5

Mean of data set = (294 + 295 + 296 + 295 + 310)/5 = 298

Datax-µ(x-µ)2Sum of (x-µ)2/nSquare root of (Sum of (x-µ)2/n)
294-41636.46.03
295-39  
296-24  
295-39  
31012144  
 Sum =182  

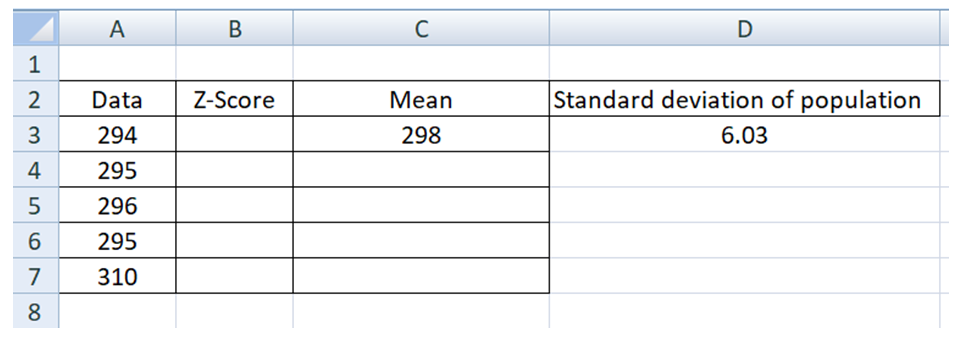
Mean, µ = 298, Standard deviation of population = 6.03, so Z-score is equal =

Z-Score = [xi-Mean]/ σ

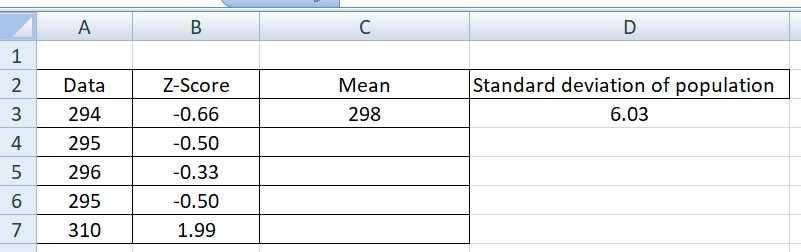
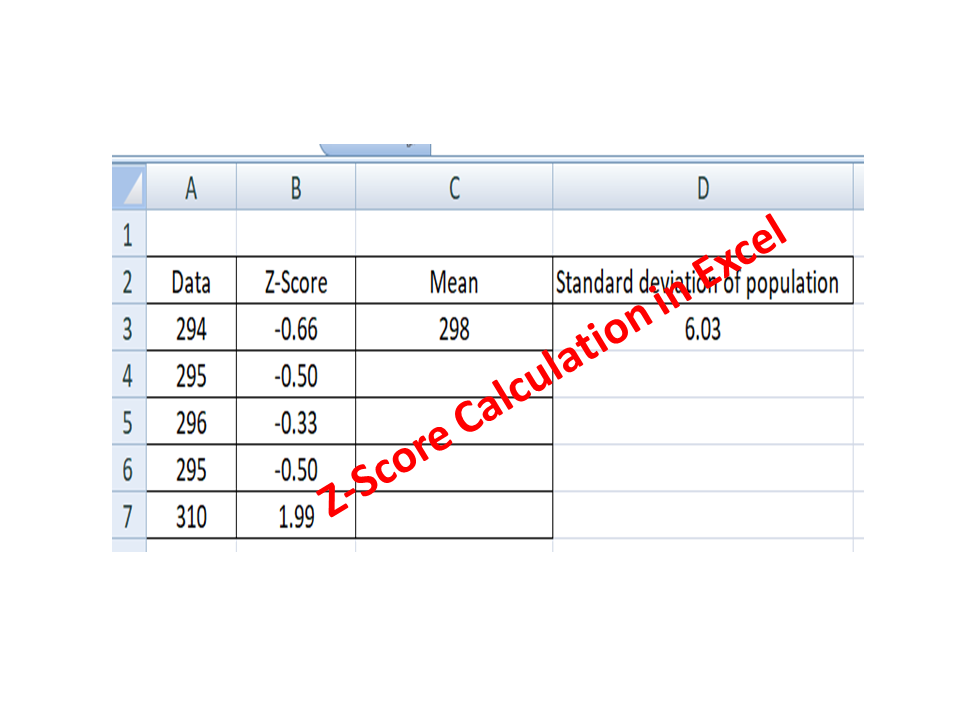
For data value “294” Z-score equal to = (294-298)/6.03 = -0.66, similarly we have calculated the z-score for data set.

DataZ-Score
294-0.66
295-0.50
296-0.33
295-0.50
3101.99
Excel Calculation Methods:

Step-1: Open the excel sheet

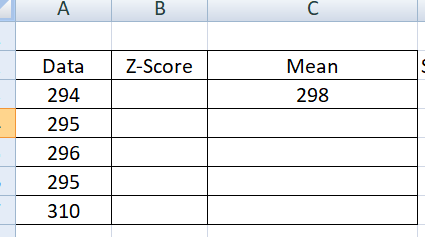
Step-2: Type the data value like below in the Excel sheet

Data
294
295
296
295
310

Step-3: Use the below Excel function formula to calculate the mean
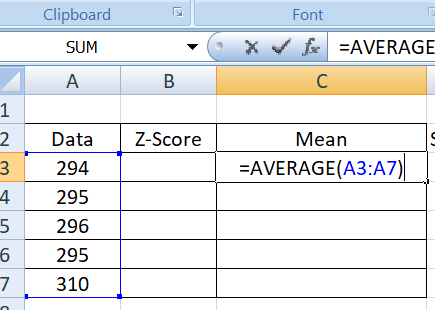
How to calculate z-score in excel
mean value
Step-4: Use below excel function formula to calculate the standard deviation of the data set.
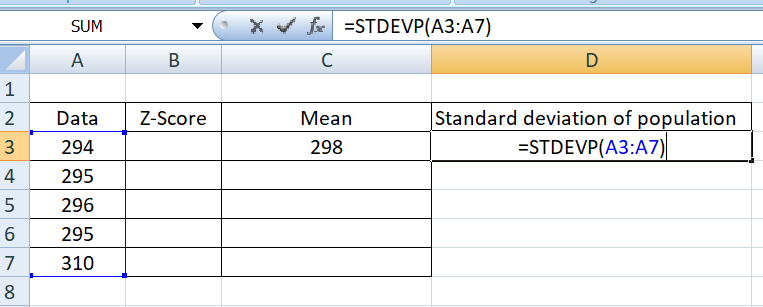
standard deviation calculation
std value

Step-5: Use the below function formula to calculate the individual Z-score of all data value
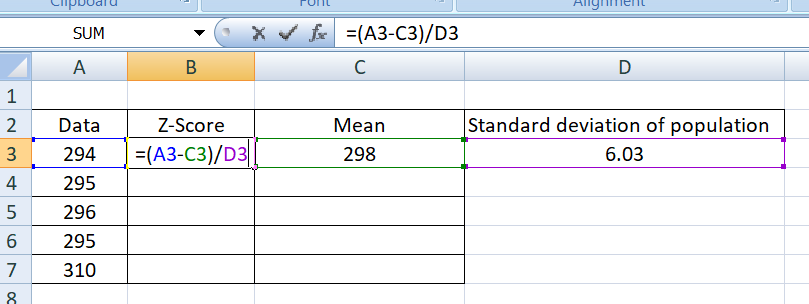
How to calculate z-score in excel

Conclusion and data interpretation: As per the organization outlier criteria, the data value 310 is the outlier data among the above data set because the Z-score is 1.99 which is greater than the value of 1

Free Templates / Formats of QM: we have published some free templates or formats related to Quality Management with manufacturing / industrial practical examples for better understanding and learning. if you have not yet read these free template articles/posts then, you could visit our “Template/Format” section. Thanks for reading…keep visiting techiequality.com

Popular Post

7QC Tools for Problem Solving | What are 7 QC Tools

7QC Tools for Problem Solving

7QC Tools for Problem Solving | What are 7 QC Tools

7QC Tools for Problem Solving techniques are generally used in manufacturing, Non-manufacturing industries, and service sectors to resolve problems.

Download 7-QC Tools Template/ Format

Definition and History:-

The 7QC Tools (Also Known as “Seven Basic Tools of Quality”) originated in Japan. First emphasized by Kaoru Ishikawa, a professor of engineering at Tokyo University and the father of “quality circles”. These tools are used to solve critical quality-related issues. You can use the 7 basic tools of quality to help understand and solve problems or defects in any industry. With the help of Excel, you can plot the graphs / Diagrams to resolve the daily quality problems. I will help you to understand the basic ideas and knowledge of 7QC Tools and their usage.

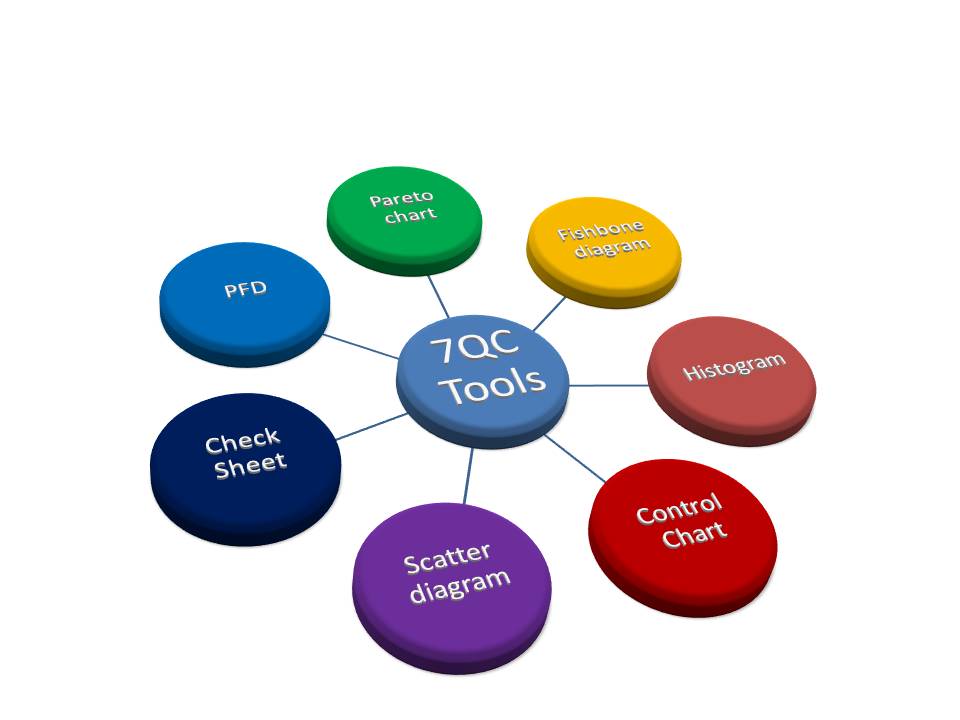
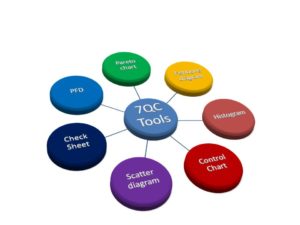
For solving problems seven QC tools are used Pareto Chart, Cause & Effect Diagram, Histogram, Control Charts, Scatter Diagrams, Graphs/Process Flow Diagram, and Check Sheets. All these tools are important tools used widely in the manufacturing field to monitor the overall operation and continuous process improvement. seven QC tools are used to find out the Root cause of the problem and implement the action plan to improve the process efficiency.

7QC tools are:-

  1. Pareto Chart
  2. Cause and effects diagram
  3. Histogram
  4. Scatter Diagram
  5. Control Chart
  6. Check Sheet
  7. PFD(Process Flow diagram)/Graphs
7QC Tools for Problem Solving

 Benefits of 7QC Tools:-

  • Improve management decisions.
  • Simple and easy for implementation
  • Continuous quality improvement
  • Quick results
  • Enhances customer satisfaction through improved quality product
  • Reduce cycle time and improve efficiency
  • Control cost of poor quality / Cost of quality
  • Reduce defects and optimize the production
  • Reduce variations and improve the quality of Products
  • Encouragement of teamwork and confidence
  • Enhancement of customer focus.

Pareto Chart:-

A Pareto Chart is named after the Italian Economist Vilfredo Pareto. It is a type of chart that contains both bars and a line graph, where the individual values are represented in the bar graph in descending order (largest to smallest value) and the cumulative percentage is represented in the line graph.

Click here to learn “How to Plot Pareto Chart In Excel”.

Understanding the Pareto Chart principle (The 80/20 rule): 

The Pareto principle is also known as the 80/20 rule derived from the Italian Economist Vilfredo,

The principle is understood as –

20% of the input creates 80% of the results

Or

80 % of the effects come from 20% of the causes.

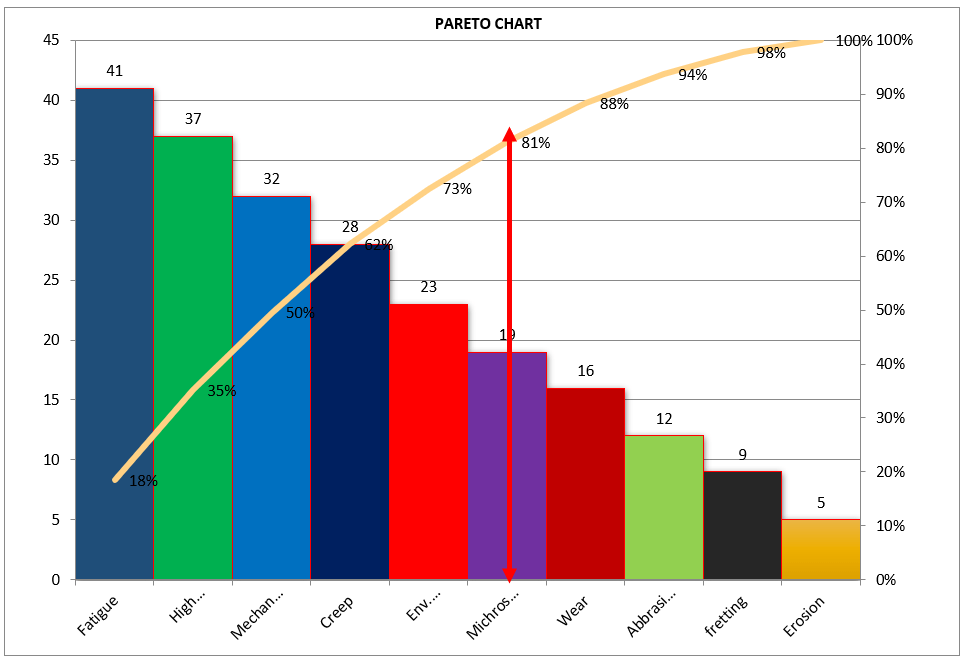
Pareto Chart Example

[Figure-1]

In the above Pareto Chart[Figure-1], we can see the cumulative% in the line graph, According to the Pareto Chart principle 80/20 rule, the 80% cumulative in the line graph is filling under the low hardness, which means BH, Damage, SH and Low hardness defers are coving the 80% of contribution over total types of defects. And those 80 % of contributions were due to the 20% caused.

 Histogram:-

The histogram is one of the 7QC tools, which is the most commonly used graph to show frequency distribution.

Helps summarize data from a process that has been collected over a period of time.

Click here to know the “How to Plot Histogram in Excel:

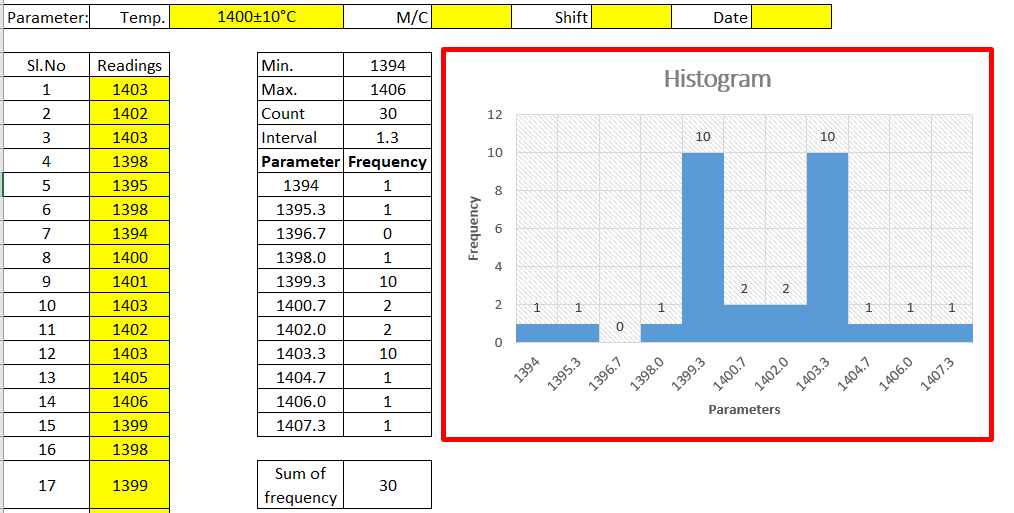
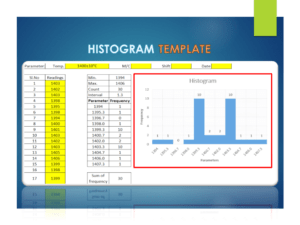
Histogram Template
Histogram Template

[Figure-2]

Fish-bone Diagram/Cause and Effects /Ishikawa Diagram:-

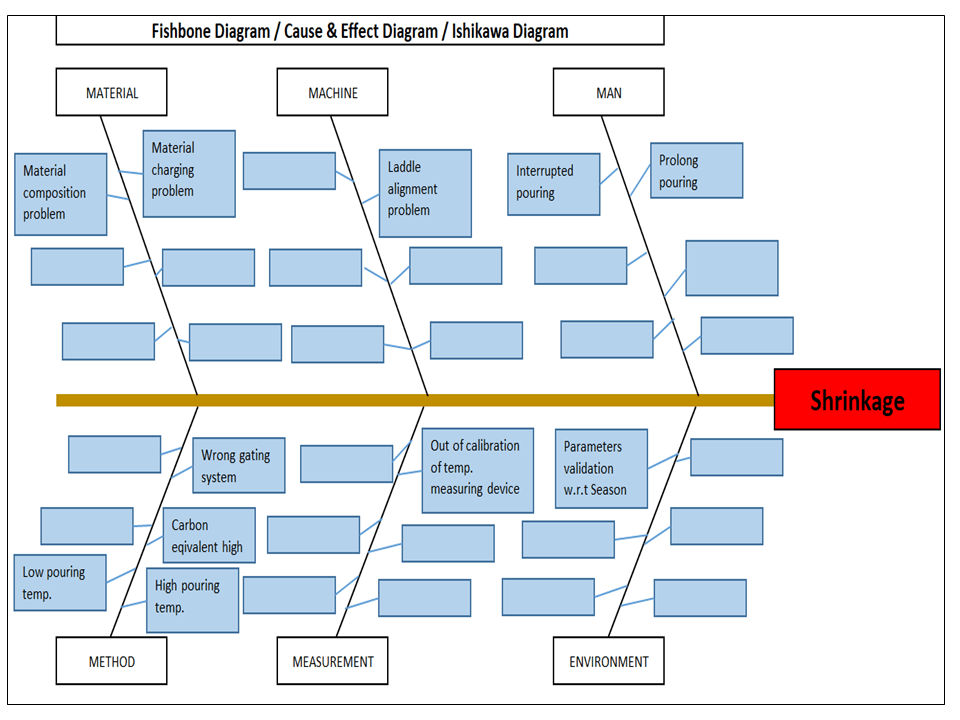
The cause and Effects Diagram looks like a fish that’s why it’s called Fish-bone Diagram, also called the Ishikawa diagram.

It’s a visualization tool for categorizing the potential causes of a problem in order to identify its root causes.

CFT members are identifying the potential cause through the Brainstorming process of individuals and together.

 The Potential cause is related w.r.t below as

  • Machine
  • Manpower
  • Environment
  • Method
  • Materials
  • Measurement
Fishbone Diagram Example

[Figure-3]

Scatter diagram:-

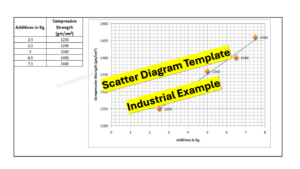
The scatter diagram graphs pairs of variable data, with one variable on each axis, to look for a relationship between them. If the variables correlate, the points will fall along a line or curve. The better the correlation, the more points will strongly cluster to the line. It generally gives the idea of the correlation between the variables.

Scatter Diagram Template

[Figure-4]

In the above figure-4, the positive and Negative correlation is only due to the direction, and in both the correlation, points are clustered to the line but in the last figure in figure-4, Points are not clustered to the line but spread over the X and Y-axis.  

Control Chart:-

A line on a control chart is used as a basis for judging the stability of a process. If the observed points are beyond a control limit then it is evidence that special causes are affecting the process.

Control Charts can be used to monitor or evaluate a process.

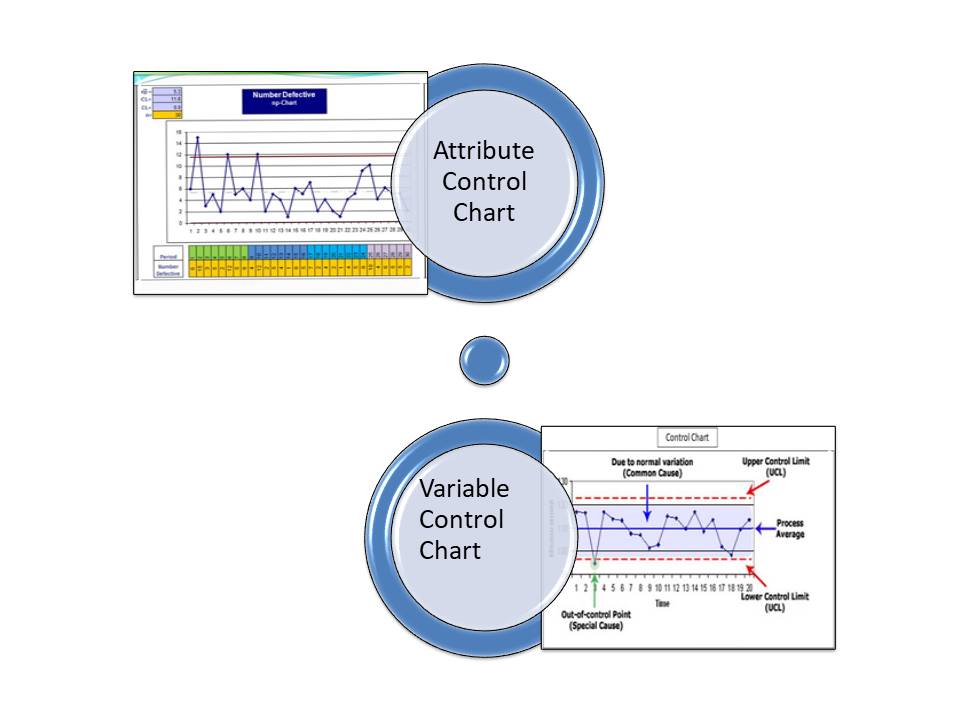
There are basically two types of control charts, those for variable data and those for attributes data.

Click here to learn more about the Control Chart and Statistical Process Control. 

Benefits:-Higher Quality, Lower Unit Cost, Higher effective Capability, etc.

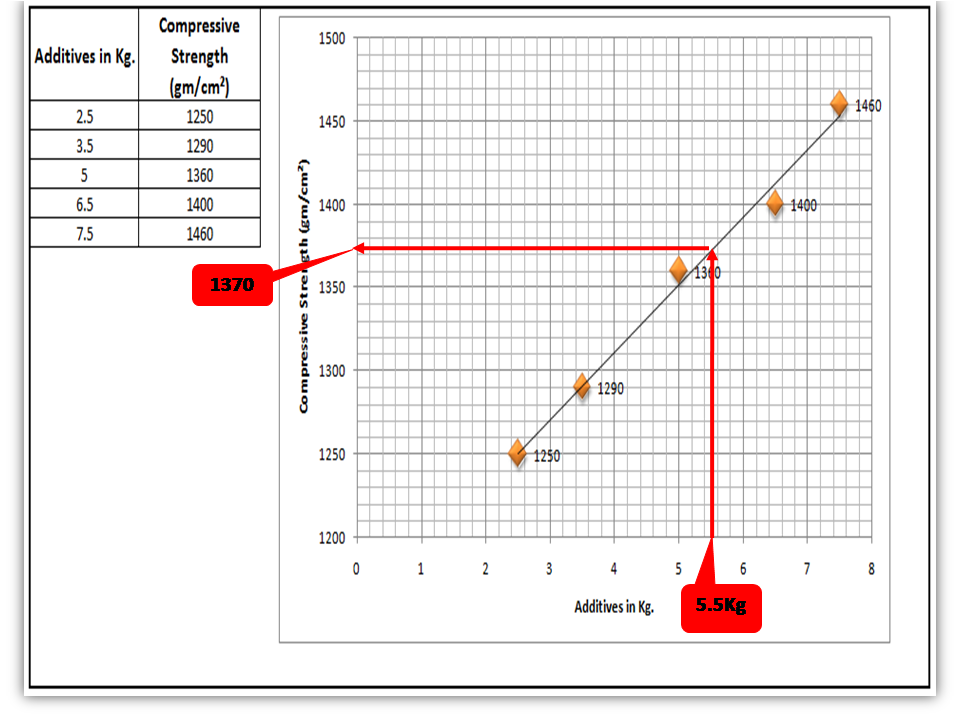
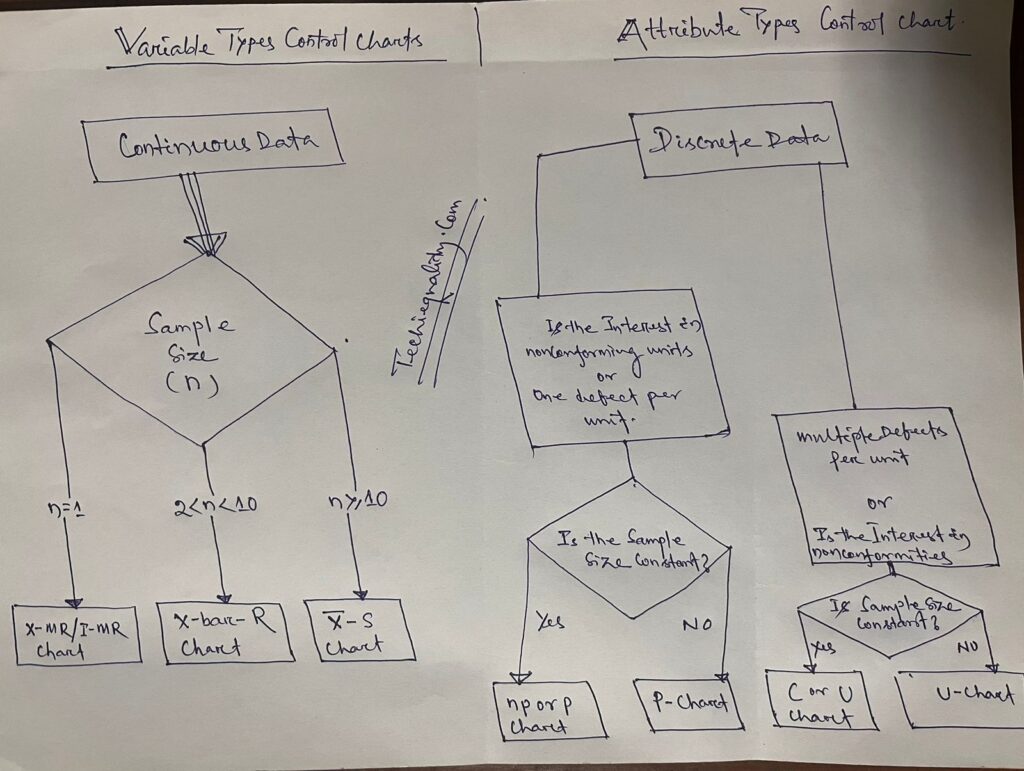
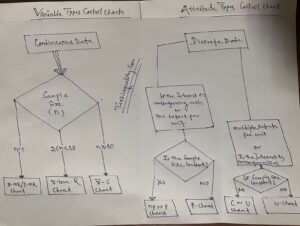
Selection of Control Charts based on Attribute / Variable Type Data:-

selection of control chart

Calculation of Average and Range Charts-

Click here to know the details.

The formula of the Attributes Control Chart:-

Click here to learn the formula and calculation.

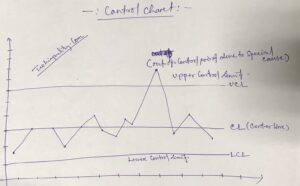
Nomenclature of Control Chart:-

7QC tools for problem solving

Check Sheet:-

Check Sheet is a simple document used for collecting data in real time. Variable or Attribute type data is collected through a Check sheet. A check sheet generally helps to make the decision on the basis of a fact and to collect the data for analysis and evaluation.

Sample check Sheet:-

LogoTitle:-………Format No-

Issue no-…  rev. no-

Date-

ParametersSpecificationObservationsRemarks


           Checked by:-                                                                  Verified by:-

Process Flow diagram/Graphs:-

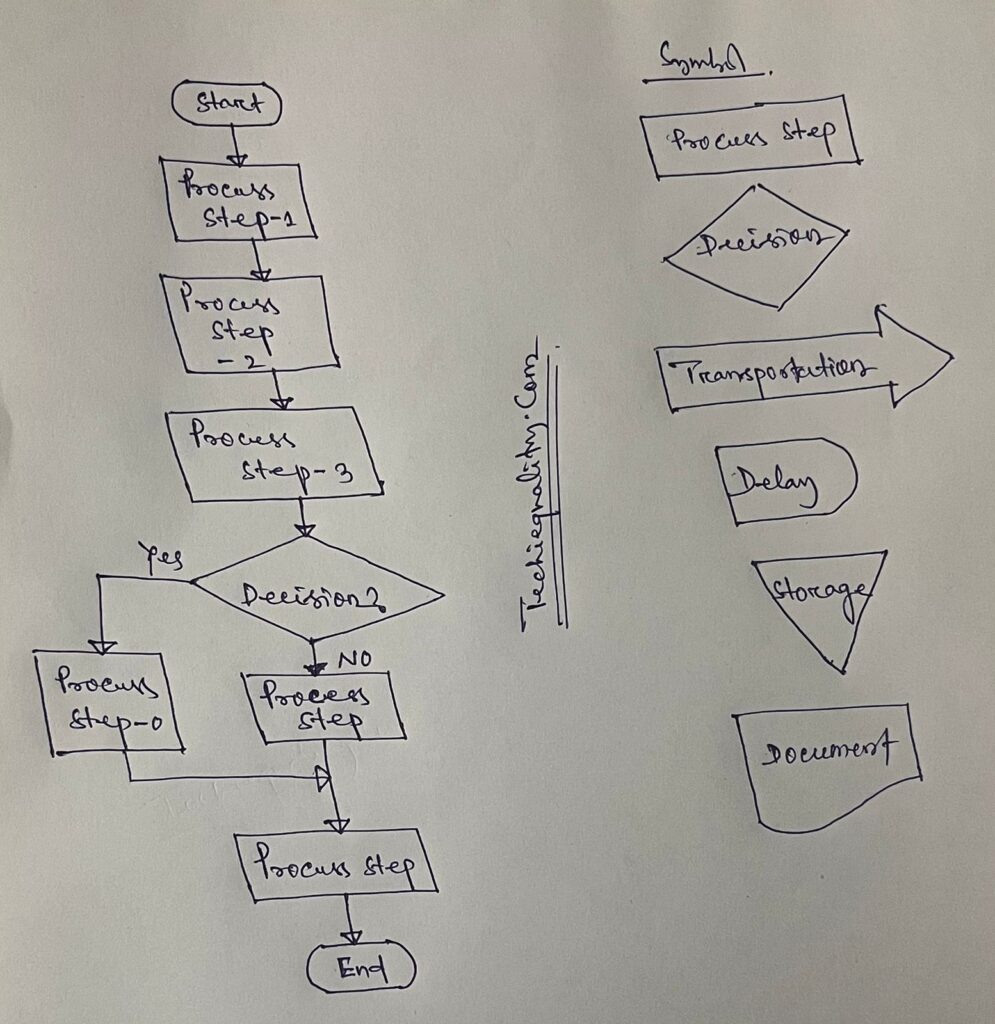
A process flow diagram is a diagram used to indicate the general flow of plant processes and equipment.

flow chart

The 7QC tools are the most commonly used tool in the industry for improvement, With the help of the 7QC tools you can understand the process/activities, analyze the data, and interpret the result/graph/output.

FAQ:

Which are the 7 QC tools?

The seven QC tools are

  1. Pareto Chart
  2. Fishbone diagram
  3. Histogram
  4. Scatter Diagram
  5. Control Chart
  6. Check Sheet
  7. PFD(Process Flow diagram)/Graphs /Stratification

Useful Article:

why why analysis methodology | 5-why analysis step by step guide

Rework vs Repair |IATF Requirement for Control of Reworked/ Repaired Product

How to plot the Run Chart in Minitab

Run Chart Example | Concept & Interpretation of Result with Case Study | Industrial Example:

Thank you for reading..keep visiting Techiequality.Com

I hope the above article “7QC Tools for Problem Solving” is useful to you…

Popular Post:

What is SPC | SPC Tools

What is SPC

What is SPC | SPC Tools

What is SPC ? SPC is the Statistical Process Control.

History and Definition:-

Statistical Process Control is a technique of quality control that services statistical methods to monitor and control processes. This ensures the process stability and consistency, producing more conforming products with less waste (Defects free). SPC helps us to indicate the common and special cause’s presence in the process. SPC is generally focused on continuous improvement.

Statistical Process Control was established by Walter A. Shewhart at Bell Laboratories in the year 1920 and he developed the control chart in 1924.

The control chart is the key tool for statistical process control. The control chart is used on both variable and attribute-type data.

Here is the full description of What is SPC?

Benefits of Statistical Process Control:-

  • Optimize the productivity
  • Reduced scrap, rework, warranty, and defects
  • Increased efficiency
  • Improved customer satisfaction
  • Improved the Process capability
  • Reduced COPQ.

Control Chart-

  • A line on a control chart is used as a basis for judging the stability of a process. If the Measure points are beyond a control limit(UCL, LCL) then it evidences that special causes are affecting the process.
  • Control Charts can be used to evaluate a process.
  • There are basically two types of control charts, for variable data and attribute data.

The use of statistical techniques such as control charts to analyze a process, so as to take appropriate actions to improve the process capability.

Nomenclature of Control chart:

7QC tools for problem solving

Selection of Control Charts based on Attribute / Variable Type Data-

selection of control chart

 Variables Control chart:

Average and Range Chart (X͞    and R):

Subgroup Average:

X͞   =(x1+x2+x3+…+xn)/n

n= number of samples in subgroup

Subgroup Range:

R= Xmax-Xmin (Within each subgroup)

Grand Average:

X͞͞ ͞  = (͞x1+x͞2+…+x͞k)/k

k=number of subgroups used to determine the grand average and average range.

Average Range:

R͞ =(R͞1+ R͞2+…R͞k)/k

Estimate of the standard deviation of X:

Standard Deviation =R͞ /d2

Estimate of the standard deviation of X͞:  =(R͞ /d2  )/√n

Centre line:

CLx͞ = X͞ ͞

Centerline of Range =R͞

Control Limits:

UCLx͞ = X͞ ͞ +A2R͞

Upper control limit of Range = D4R͞

Lower Control limits of X͞ = X͞ ͞ -A2R͞

Lower Control limit of Range=D3R͞.

(For Subgroup size 5, A2=0.577, d2=2.326, D4=2.114)


Attributes control Chart:

P chart (for proportions of units in a category)

Centre line = P͞

Control limits:

Samples not necessarily of constant size

Upper control limits: P͞ +3x √(p͞(1-p͞)/√n)

Lower Control limits: P͞ -3x √(p͞(1-p͞)/√n)

If the sample size is constant (n):

Upper control limits: P͞ +3x √(p͞(1-p͞)/√n)

Lower Control limits: P͞ -3x √(p͞(1-p͞)/√n)

Different types of Attributes type control chart:

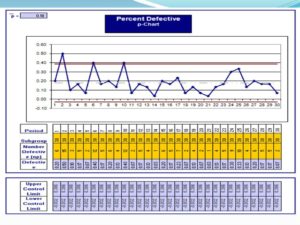
[P-Chart]

What is SPC

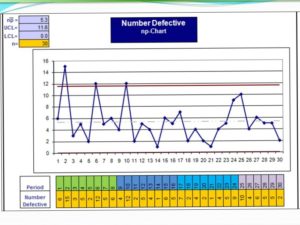
[np-Chart]

What is SPC

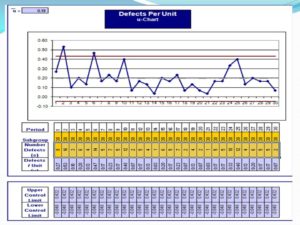
[u-chart]

What is SPC

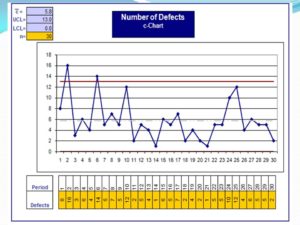
[c-chart]

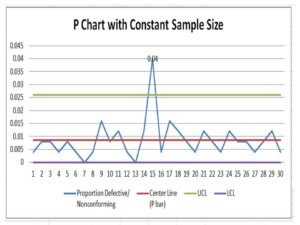
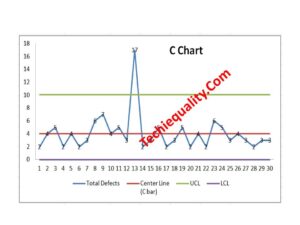
In the Above c-types Control chart, two numbers observe points are fall outside of upper control limits, this means the control chart gives an alarm that the process has some special cause that we need to take immediate action to control the process in stable conditions.

Interpretation of Result (Both Attributes and Variable types Data Control chart):

The Control Charts would indicate that a process is out of Control if either one of these is true-

  1. One or More points fall outside the Control Limits
  2. When the Control Charts are divided into 3 sigma zones –
  1. Nine Consecutive points are on one side of the average
  2. There are six Consecutive points, increasing or decreasing.
  3. There are fourteen consecutive points that alternate up or down.

The SPC- Statistical process control is one of the best methodologies to control the process. It is commonly used in manufacturing industries for process control & improvement.

FAQ:

What is an SPC used for?

The SPC is a statistical process control that is used for process control by statistical techniques/methods/tools. (like a control chart, process capability, etc). 

Thank you for visiting the Website Techiequality.com.

Once again thank you so much……

Popular Post:

Corrective and Preventive Action Format | CAPA with Example

Corrective and Preventive Action Format, capa format, capa format in word, capa format in excel

Corrective and Preventive Action Format | Download CAPA Format:

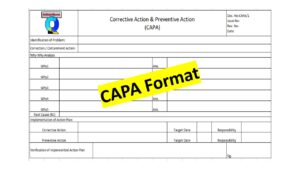
Corrective and Preventive Action Format with an example is illustrated below. CAPA has generally eliminated the causes of nonconformity. It is usually a set of actions i.e corrective action and preventive action, An Action to eliminate the Root cause of Non-conformity is called corrective action, and an action to eliminate the potential cause of non-conformity is called Preventive action.

Download CAPA Format / Template.

Free Download QMS & EHS Template/Format.

Download Corrective Action Format 

You could like to read the below post:

why why analysis methodology | 5-why analysis step by step guide.

Free Download (QA, QC & 7-QC Tools Template /Format /form).

If you would like to learn more details on the CAPA Process & CAPA manufacturing example then read two important articles;

Corrective and Preventive Action (CAPA):

After knowing the symptom of the Problems why-why analysis plays a major part in identifying the root cause of the symptom of the problem.

In Industry CAPA is used to bring about improvement in process operation and to eliminate the causes of Problems.  Corrective and preventive action is also a part of the Quality management system. CAPA is fully followed by the PDCA cycle for the implementation of the action plan and for monitoring the effectiveness of the action plan.

Corrective action implemented w.r.t the Customer Return, field failure, Manufacturing Process defects, warranty failure, Product design failure, server failure, etc.

Preventive action is implemented in reaction to identifying the potential cause of nonconformity. Common preventive actions in industries are given below, but are not limited to:

  • Process/ potential failure Mode and Effects Analysis.
  • Design Failure mode and effects analysis
  • Quality Assurance Plan/ Control Plan
  • Standard Operating Procedure / Work Instruction.
  • Error Proofing/ Poka-yoke/ Mistake Proofing
  • Reaction plan
  • Risk mitigation plan
  • Alarms System
  • Process Validation
  • Product validation
  • Process layout.
  • Process feasibility study
  • Education and Training (Class Room / On-job-Training)
  • Preventive maintenance.
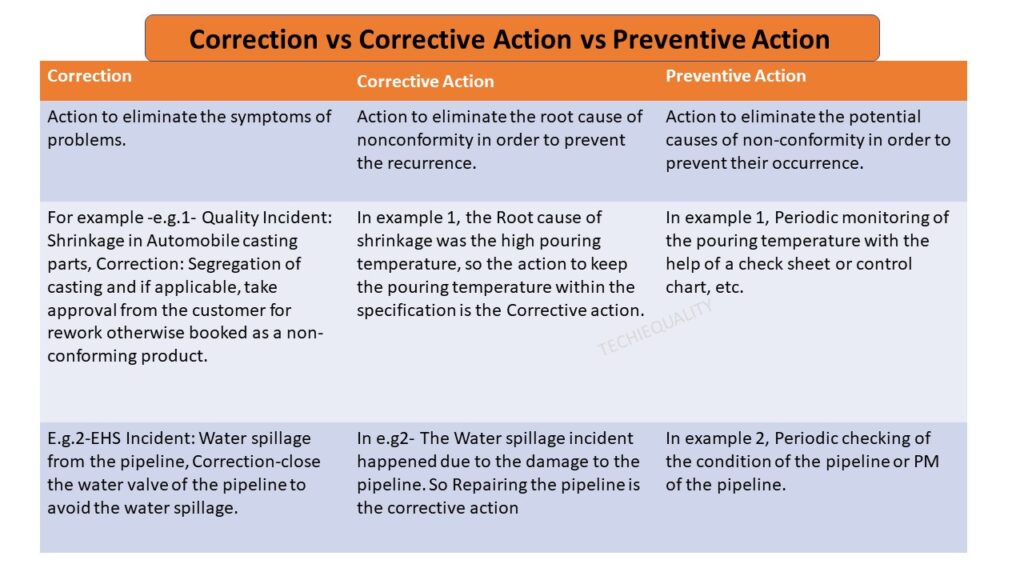
Corrective Action vs Preventive Action:
CorrectionCorrective ActionPreventive Action
Action to eliminate the symptoms of problems.Action to eliminate the root cause of nonconformity in order to prevent the recurrence.
The action to be taken in order to eliminate the root cause.
Action to eliminate the potential causes of non-conformity in order to prevent their occurrence.
To eliminate the potential cause of problems.
The action to be taken in order to avoid root cause recurrence.
For example -e.g.1- Quality Incident: Shrinkage in Automobile casting parts, Correction: Segregation of casting and if applicable, take approval from the customer for rework otherwise booked as a non-conforming product.In example 1, the Root cause of shrinkage was the high pouring temperature, so the action to keep the pouring temperature within the specification is the Corrective action.In example 1, Periodic monitoring of the pouring temperature with the help of a check sheet or control chart, etc.
E.g.2-EHS Incident: Water spillage from the pipeline, Correction-close the water valve of the pipeline to avoid the water spillage.In e.g2- The Water spillage incident happened due to the damage to the pipeline. So Repairing the pipeline is the corrective actionIn example 2, Periodic checking of the condition of the pipeline or PM of pipeline.
Correction vs Corrective action vs Preventive action
Corrective Action vs Preventive Action
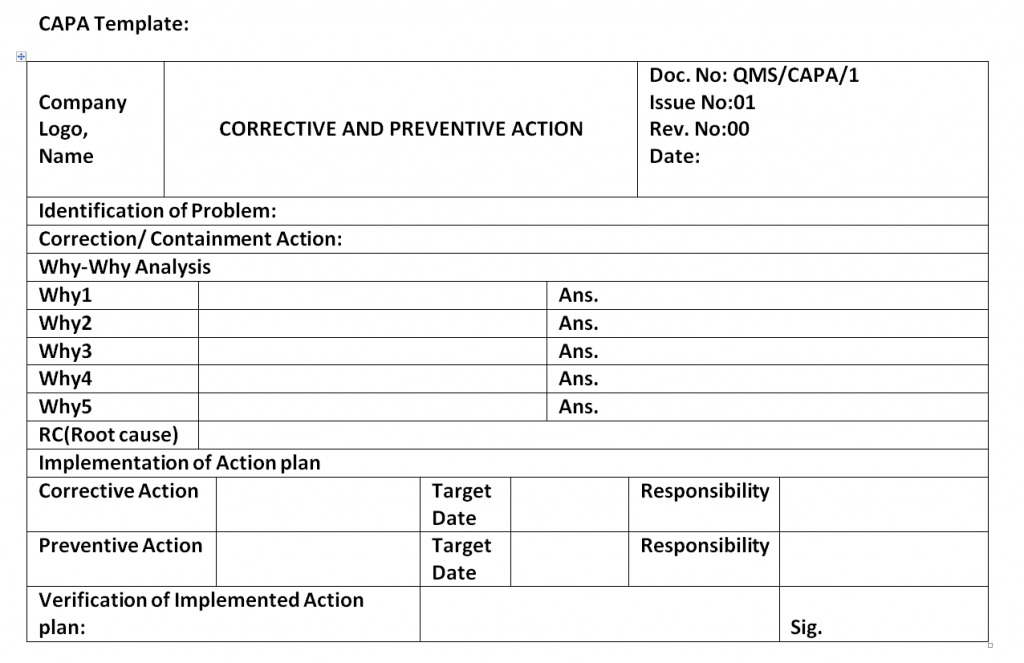
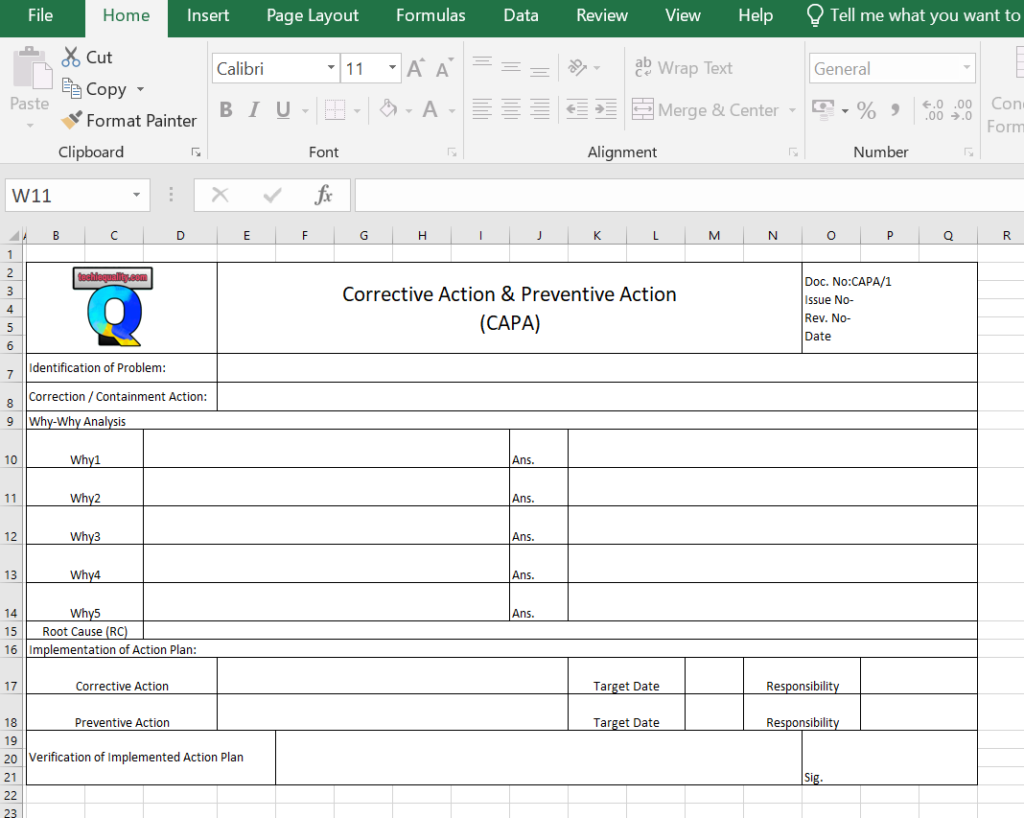
Corrective and Preventive Action Format / CAPA Format / CAPA Template in Word
Corrective and Preventive Action Format
Corrective and Preventive Action Format-DOWNLOAD

Use our approved simple & best formats or templates in your organization/ manufacturing units and provide us with your valuable feedback. DOWNLOAD-Template/ Format of 7QC tools, Cp & Cpk Calculation Sheet, FTA, 5W2H, 5W1H, SWOT Analysis format, Run Chart, 8D Format, Control Chart, OEE calculation excel sheet, CAPA Word format /Template, etc.

CAPA Format in Excel
capa format in excel
CAPA Format in Excel-DOWNLOAD
Corrective and Preventive Action Format filled up Example-1 :
Corrective and Preventive Action Format
Corrective and Preventive Action Format-DOWNLOAD

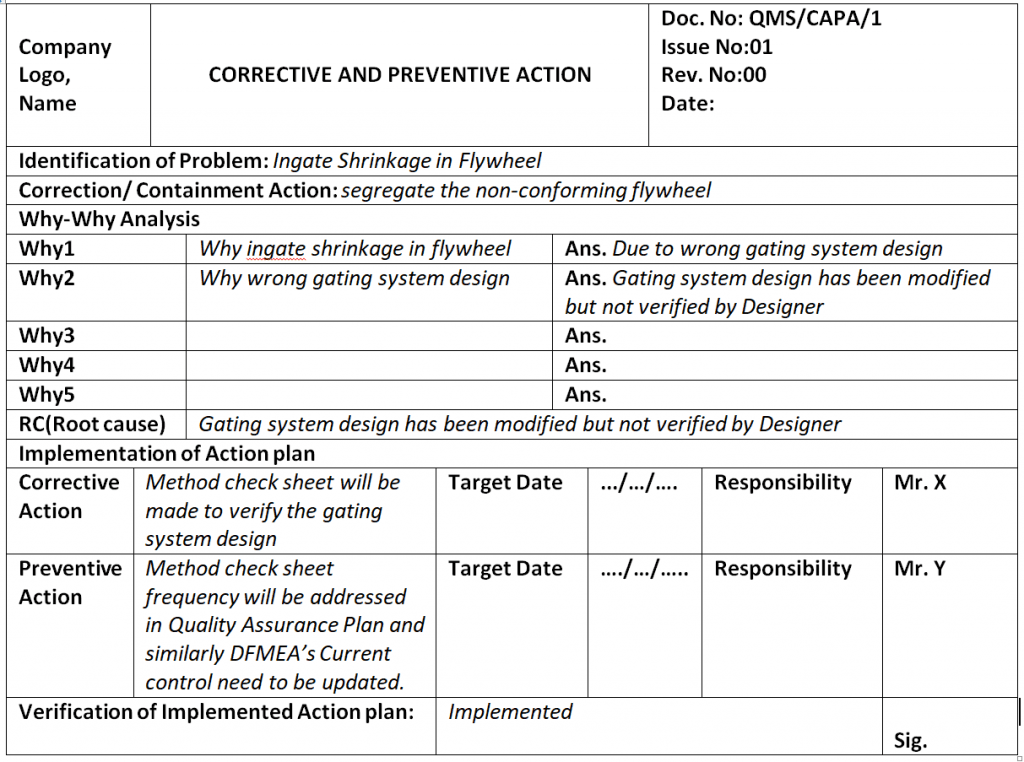
EXAMPLE-1: Shrinkage Defect

Identification of Problem: Ingate Shrinkage in Flywheel

Correction/ Containment Action: segregate the non-conforming flywheel.

Why-Why Analysis:

Why-1 Why Ingate shrinkage in a flywheel Ans. Due to the wrong gating system design
Why-2 Why the wrong gating system design Ans. The gating system design has been modified but not verified by the Designer
Why-Why Analysis.
RC(Root cause): The gating system design has been modified but not verified by the Designer
Root Cause.
Implementation of the Action plan:
Corrective Action A method check sheet will be made to verify the gating system design Target Date xx/yy/2020Responsibility Mr.Z
Preventive Action Method check sheet frequency will be addressed in the Quality Assurance Plan and similarly, DFMEA’s Current control needs to be updated. Target Datexx/yy/2020Responsibility Mr.Z
Action Plan Example.
Verification of Implemented Action Plan: Implemented.
[Verification]

EXAMPLE-2:

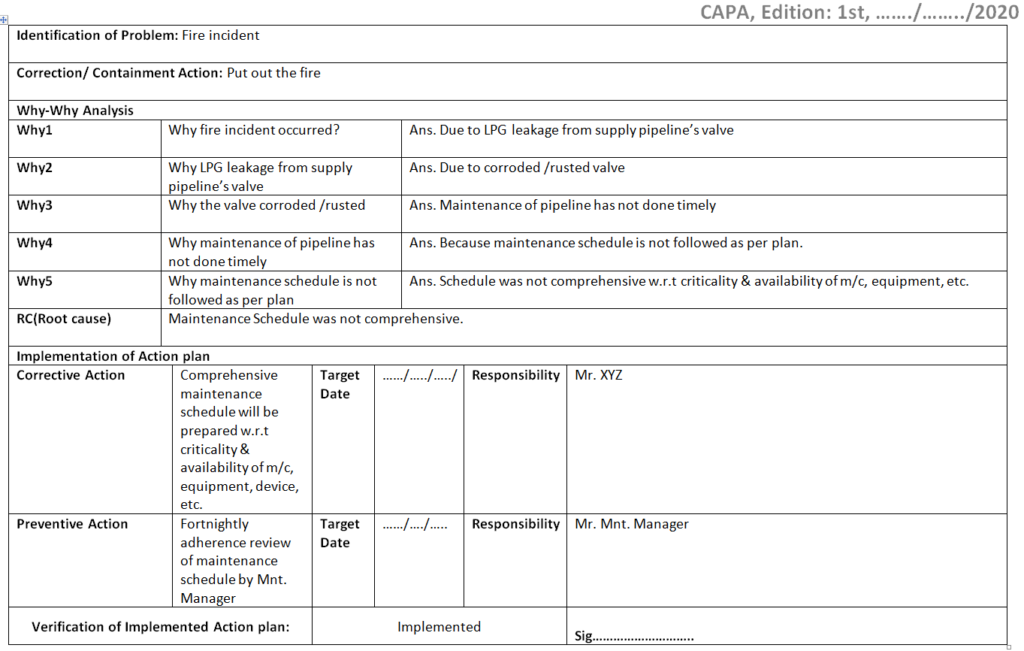
Details description of Example-2 (CAPA of Fire Incidents):

Identification of Problem: Fire incident.

Correction/ Containment Action: Put out the fire.

Why-Why Analysis of Fire Incident.
Why-1Why fire incidents occurred?Ans. Due to LPG leakage from the supply pipeline’s valve
Why-2Why LPG leakage from the supply pipeline’s valve?Ans. Due to a corroded /rusted valve
Why-3Why is the valve corroded /rusted?Ans. Maintenance of the pipeline has not been done timely
Why-4Why maintenance of the pipeline has not been done timely?Ans. Because the maintenance schedule is not followed as per plan.
Why-5Why maintenance schedule is not followed as per the plan?Ans. The schedule was not comprehensive w.r.t criticality & availability of m/c, equipment, etc.
5-W Analysis

RC (Root cause): The maintenance Schedule was not comprehensive.

Implementation of the Action Plan:
Corrective Action: A comprehensive maintenance schedule will be prepared w.r.t criticality & availability of m/c, equipment, device, etc.Responsibility: Mr. XYZ (Maintenance Engineer)
Preventive Action: Fortnightly adherence review of maintenance schedule by Mnt. Manager.Responsibility: Mr. PQR (Maintenance Manager)
Action Plan Example
Verification of Implemented Action plan: Implemented

Filled up CAPA Format in Word:

capa template
CAPA format filled up with examples of fire incidents

EXAMPLE-3:

In this example-3, we will discuss the latest type of format or template of CAPA, as you know the preventive action part does not exist in ISO 9001:2015 standard, and the same was replaced by Risk, so we have to analyze the risk instead of preventive action. Hence considering with new ISO 9001:2015 standard we have prepared a new format/template called the Corrective action & risk analysis template and illustrated the same with simple examples.

CORRECTIVE ACTION & RISK ANALYSIS TEMPLATE

How to fill up the CARA Template /Format? (Illustrated with example):

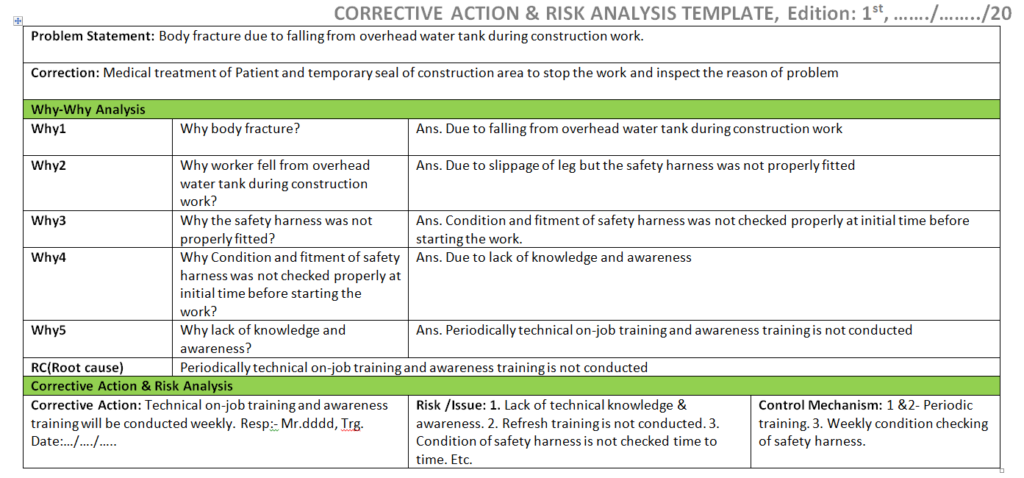
Problem Statement: Body fracture due to falling from an overhead water tank during construction work.

Correction: Medical treatment of the Patient and temporary seal of the construction area to stop the work and inspect the reason for the problem.

Root Cause Analysis:

We have done the root cause analysis given below using the 5Whys tools.

Why-Why Analysis:
Why-1Why body fracture?Ans. Due to falling from an overhead water tank during construction work
Why-2Why worker fell from an overhead water tank during construction work?Ans. Due to slippage of the leg but the safety harness was not properly fitted
Why-3Why the safety harness was not properly fitted?Ans. The condition and fitment of the safety harness were not checked properly at an initial time before starting the work.
Why-4Why Condition and fitment of the safety harness were not checked properly at the initial time before starting the work?Ans. Due to a lack of knowledge and awareness
Why-5Why lack of knowledge and awareness?Ans. Periodically technical on-job training and awareness training is not conducted
5-Why Analysis

RC (Root cause): Periodically technical on-job training and awareness training are not conducted

Corrective Action & Risk Analysis:
Corrective Action: Technical on-job training and awareness training will be conducted weekly. Resp: – Mr.dddd, Trg. Date:…/…./…..Risk /Issue: 1. Lack of technical knowledge & awareness. 2. Refresh training is not conducted. 3. The Condition of the safety harness is not checked from time to time. Etc.Control Mechanism: 1 &2- Periodic training. 3. Weekly condition checking of safety harnesses.
CARA Report
capa format
CARA format
Example-4:

Here, we are going to discuss one example related to an accident and consider the same scenario for CAPA analysis. let’s say an accident occurred at a manufacturing unit while a man operating a machine. A CFT has been formed to analyze the accident and they prepared the CAPA report, which is mentioned below;

Correction: Medical treatment was provided to the patient and temporarily barricade the zone and machine for inspection purposes.

Root Cause: Lack of awareness

Corrective Action: Awareness training shall be provided to operators/workers

Preventive Action: Periodically awareness training needs shall be identified and the same to be imparted to concerned personnel.

FAQ1:
  • What ISO 9001:2015 Said about CAPA?
  • Ans: As you know the new ISO 9001:2015 standard asked about Correction, Corrective Action, and Risk & its mitigation plan. but not asked for preventive action. same mentioned in clause no.10.2 Nonconformity and corrective action in ISO 9001:2015 Standard. and for retained documented information, ISO 9001 asked for mandatory requirements as evidence of 1] the nature of the nonconformity and any subsequent actions taken. 2] the results of any corrective action.
  • What IATF 16949:2016 Said about CAPA?
  • Ans: The new IATF 16949 standard asked for Corrective action, Preventive action, and risk. In clause no 6.1.2.1, it’s said about Risk analysis, In 6.1.2.2-Preventive action and clause no. 10.2-Nonconformity & Corrective Action. After the incorporation of risk analysis in the IATF 16949 standard, still preventive action exists there.
FAQ2:
  • What is CAPA?
  • Ans: The full form of CAPA is Corrective Action & Preventive Action. corrective action eliminates the root cause of a non-conformity and PA eliminates the cause of potential non-conformity.
  • How to write corrective and preventive action reports?
  • Ans: We have already described at the top of this post with an example, simply go through it. Anyway, the most important part is the Root cause analysis and Why-Why analysis. Once you follow the right step to complete the RCA then, it will be very easy to write the CAPA in CAPA format /report, but in the new ISO 9001:2015 standard the preventive action has been replaced by Risk analysis, so when you write the CAPA, you have to cover the correction /containment action, corrective action then, you are supposed to identify the risk.

How to fill up the CAPA format quickly?

follow the below steps to fill up the CAPA format/template quickly;

  1. Identify the problem.
  2. Take containment action
  3. Do the RCA.
  4. Implement the CA & PA.
  5. Do the document changes
  6. Monitor the effectiveness

Corrective and Preventive action as per ISO 9001:2015 & IATF 16949:2016

CAPA (ISO 9001 v/s IATF 16949):
ISO 9001:2015IATF 16949:2016
Corrective ActionExist in the new standardExist
Preventive ActionNot Exist, replaced by Risk analysisExist
Risk AnalysisNew Requirement New Requirement
CAPA Comparison Table
More on TECHIEQUALITY

OEE Calculation-How To Calculate OEE (Overall Equipment Effectiveness) with Example

OEE Calculation

OEE Calculation-How To Calculate OEE (Overall Equipment Effectiveness) with Example:-

OEE Calculation is a simple calculation which is multiplied by availability, Performance and Quality. It is a methodology to measure the productivity of Process industries. If your manufacturing process OEE indicates 100%, It means you are Producing as fast as possible with low or no downtimes. Different types of losses are generally indicated through OEE, which also improves Manufacturing Productivity and Equipment health.

Download OEE Template (Excel sheet).

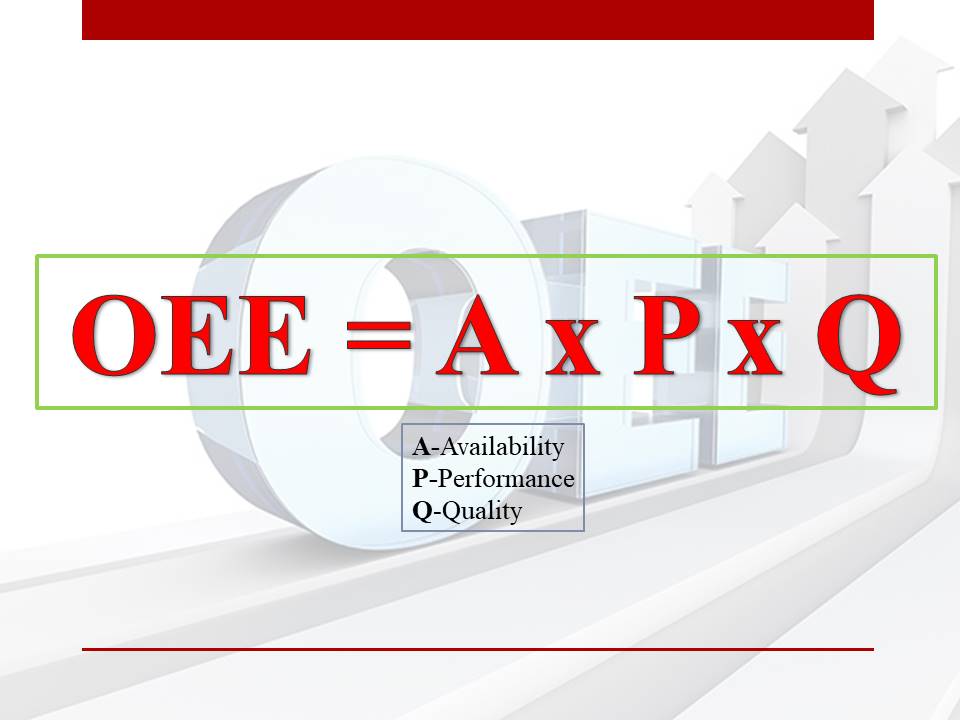
OEE = A x P x Q
A-Availability

P-Performance

Q-Quality

Availability:-

Availability = Run Time / Production Planned Time.

,(Run Time = Production Planned Time − Stop Time, Stop Time (or Downtime)=Unplanned or Planned Stops or both).

Stop Time is termed as the total time of Unplanned and Planned Stops or Total downtimes which may run the machine but due to the breakdown, the machine is unable to run.

Planned Stops are the total time taken due to  Mould or tool changeovers, Preventive maintenance or First piece quality checking time etc.

Unplanned stops are the total time taken due to equipment or machine failure.

Performance:-

Performance = Ideal Time × Total Counts  / Run Time.

It takes basically minor  Stoppage, Slow cycle times or Reduced speed.

Quality:-

Quality = Good Count / Total Count

Common Losses in Industries:

OEECommon LossesDetails
Availability LossUnplanned stoppagesEquipment failure or machine failures
Planned stoppagesMould changeover, Preventive maintenance, Set-up and adjustments
Performance LossSmall stoppagesMinor Stoppages
Slow CyclesSpeed reduction
Quality lossProduction rejectionsDefects of Process
Start-up RejectionsDefects of process
Availability Loss:-

It is the total losses due to the Unplanned and planned Stoppages.

Equipment failure or Machine Failures:

Total downtime or stoppages due to Equipment failure or Machine Failures.

Any type of Tooling failure, Unavailability of alternative tools so that awaited time for alternative tools, breakdowns and unplanned maintenance, no operators, Shortages of raw materials, and Critical maintenance parts are the Potential causes of Equipment failure.

Setup and adjustments Losses (Mould changeover, Preventive maintenance):

Setup and Adjustment time is the total loss time of Mould/tools change over time, Planned maintenance time, cleaning time, and First Piece inspection times.

Performance Loss:- 

It is the total Losses due to the minor stoppages and Slow Production Cycle times.

Minor stoppages:-

Minor stoppages are small downtime which takes a maximum of two minutes.

Material jams, obstructed product flow, Incorrect settings, misaligned or blocked sensors, and the Unintentional opening of safety Doors of machines are the Potential causes of Minor Stoppages.

Generally in TPM, those loss time to stoppages coming under the White tags are minor stoppages.

Speed Reduction:

Total loss time due to slow production cycles.

Quality loss:-

quality defects are the total loss time due to the Rework of Product, scrap and process PPM.

Defects of the process:

Defects of the process are the Total Scrap or PPM and The loss time for reworks.

How To Calculate OEE (Overall Equipment Effectiveness)

OEE Calculation is described here with Examples.

The below data are given for one shift only

ItemData
Shift Length8 hours (8*60=480 Minutes)
Breaks ( Tea and Lunch)50 minute
Downtime55 Minutes
Ideal Cycle Time1.0 Seconds
Total Production20000 Pieces
Reject Quantity320 Pieces
AvailabilityPerformanceQuality
A= Run Time / Planned Production Time

A=375 minutes / 430 minutes = 0.8720 (87.20%)

Run Time=Planned Production Time − Stop Time

Run Time=430 minutes − 55minutes = 375 minutes

Planned Production Time

=Shift Length − Breaks

=480 minutes − 50 minutes = 430 minutes

P= (Ideal Cycle Time × Total Count) / Run Time

P= (1.0 seconds × 20000 Pcs) / (375 minutes × 60 seconds) = 0.8888 (88.88%)

Q= Good Count / Total Count

Q=19680 pcs / 20000 pcs = 0.9840 (98.40%)

Good Count =

Total Count − Reject Count

=20000 Pcs − 320 Pcs = 19680 Pcs

OEE= A X P X Q =0.8720 × 0.8888 × 0.9840 = 0.7626 (76.26%)

Useful Post

How to measure process capability (Cp & Cpk)? Download Excel Template

How to measure process performance (Pp & Ppk)?

How to calculate process performance (Pp & Ppk)?

Error Proofing Understanding & Implementation of IATF 16949 Clauses 10.2.4.

Download free template. (QA, QC ,7-QC Tools)

More on TECHIEQUALITY

Thank you for reading…keep visiting Techiequality.Com

Popular Post

Implementation of KAIZEN in Industry

Implementation of KAIZEN in Industry

Implementation of KAIZEN in Industry:

Implementation of KAIZEN in Industry is the most important key to the Industry for Continuous Improvement in any type of Loss or Waste. But the sustaining of any type of kaizen is the question mark for the industry. Many industries try their best to implement the kaizen at the initial stage is become successful. but sustaining the continuous improvement program is very difficult. Kaizen is the Key Input to all types of Business system standards. We will discuss here details about the comprehensive steps of the KAIZEN implementation program and its Sustainability.

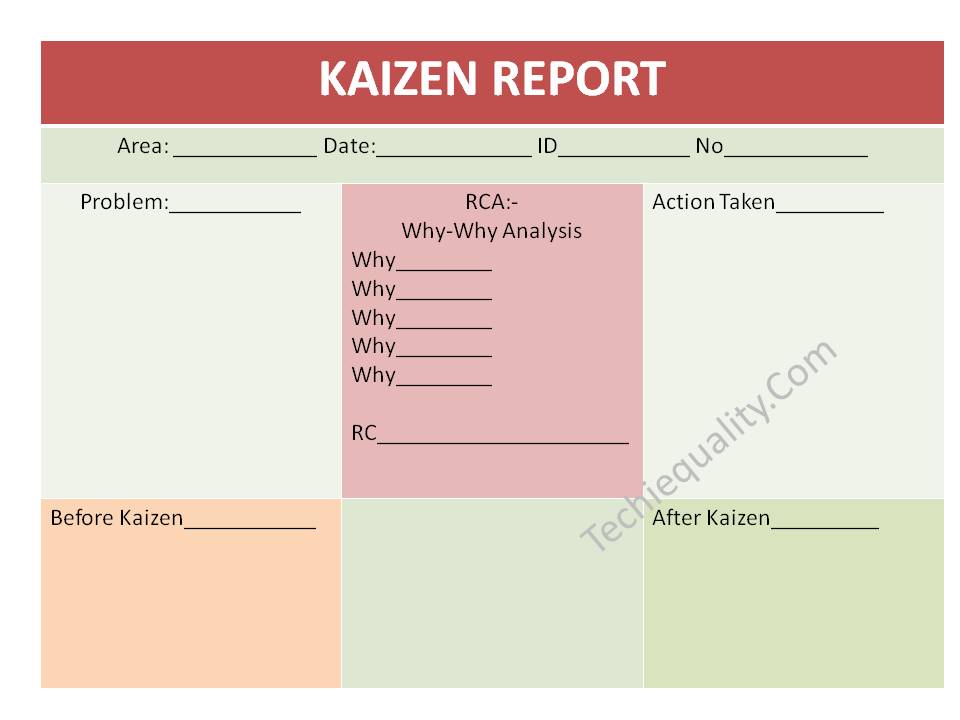
Download the KAIZEN report template or format.

Step-1: Identify the Big Losses or Wastage in process or Areas

Based on the Historical data you have to select the higher contribution losses among the sets of different types of Losses in a particular process where you would like to Improve. Basically, the Pareto chart you can use to identify the Loss contribution among the sets of losses.

Step-2 Formation of Team

It is the same as what generally all types of project teams are made. The Process or Section In-charge will be the leader of the Kaizen Project.  and other team members should be from different functions such as production, quality, development, maintenance, etc. Now leader will give contributions to clarify the individual roles and responsibilities of each and every member. Responsibility and Activity Matrix need to be prepared before going to the next step. Here is one example of an Activity matrix.

Activity Matrix of Kaizen:

Activity Matrix is the helping tool for the successful Implementation of KAIZEN in Industry Download Activity Matrix of Kaizen.

Step-3 Collection of Data

Before collecting data, you have to identify the potential cause of the problem. Data need to be collected for a better understanding of the correlation between potential causes and problems.

Step-4 Analysis

This step is the most important step for action. Here you have to do a why-why analysis. And need to follow the narrow steps of Brainstorming to identify the Root cause through the involvement of each individual member of the team.

Step-5 Implementation of Project

Here aforesaid Kaizen Activity Matrix needs to be executed for the successful implementation of the Project or you can also be laid down the milestone chart or Gantt chart for the implementation of the project. During the Project implementation budget needs to be considered.

Step-6 Achievement of Kaizen Goal

Check up on the result of kaizen and also effectiveness. Address the Tangible and Intangible benefits.

Step-7 Standardization

The job is not over yet.  here you have to prepare the SOP, Fill up the Kaizen template, need to impart awareness about Kaizen’s benefits, etc. This will call for making those a working system.  Horizontal deployment over a similar area will give you the strength of the organization as cumulative tangible and intangible benefits.

Step-8 Sustenance

In step Sustenance, Sustainability Kaizen audit on a minimum monthly basis needs to be carried out.

Kaizen Examples:

as you know Kaizen is the best practice in the manufacturing industries for continuous improvement. I am sharing here my own experience that how I was identifying the kaizen idea in several operational areas.

when I was involved in shop floor manufacturing activities, every day on the morning shift I was analyzing the line rejection with details cause, and periodically did the Q component inspection. after doing the analysis and several types of Gemba auditing, finally, I was preparing problems identified report w.r.t man, machine, methods, material, and other factors for kaizen idea / continuous improvement purpose. discussed all problems related to the concerns department and collected their suggestions/improvement points. Given below is the kaizen methodology that you can follow to implement kaizen in your work zone.

  • List out the current problems, and issues in your work areas.
  • Find out the opportunities.
  • Categories the problems and find out which one is fit for Kaizen.
  • Do the Why-Why analysis.
  • Find out the Root causes
  • Take the Action Plan (CAPA).
  • Implement the action plan
  • Monitor the effectiveness.
  • Standardize the document
  • Visualize the data, SOP, OPL, etc.
  • Calculate the cost savings.
  • Do the periodic Kaizen sustenance audit to know the actual status or function of Kaizen.
ObjectivesHelping tools/techniques/methods for kaizen
KaizenTo eliminate waste, optimize productivity, and achieve continuous improvement.Engineering changes, Poka-yoke, SOP, OPL, PDCA, SDCA, Lean QC, QC, DMAIC, etc.

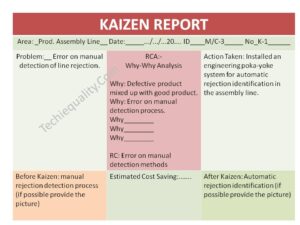
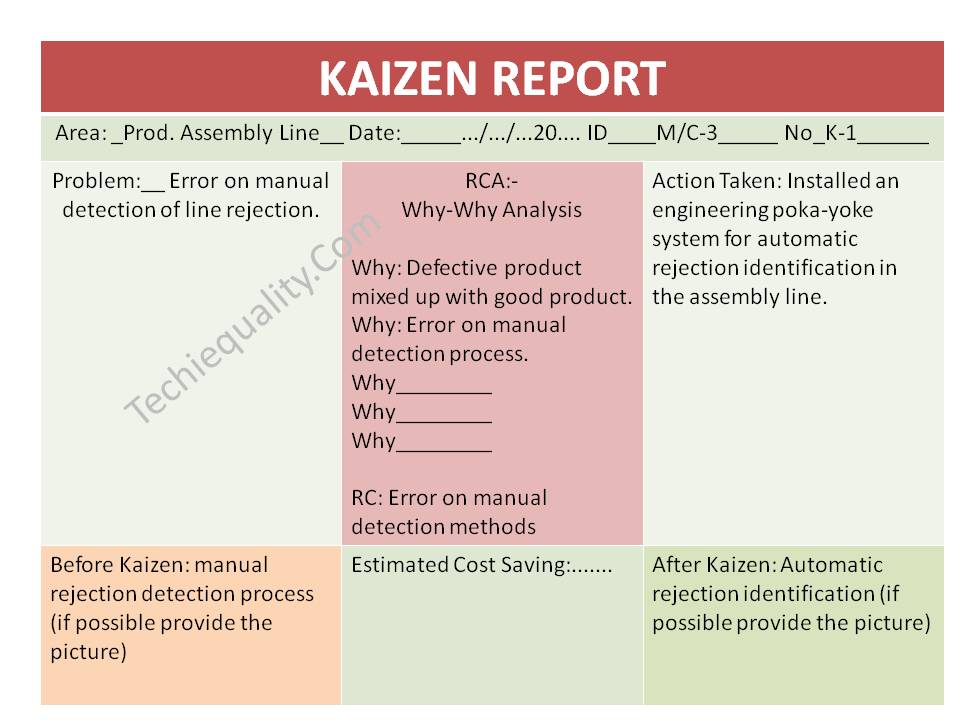
For kaizen examples, let’s say a company has a manual process for line rejection identification in the product assembly line, The engineering team developed a Kaizen idean and installed an engineering poka-yoke system for automatic rejection identification in the assembly line. we have prepared the same in the kaizen report, which is given below;

kaizen examples

Kaizen Template:

Below kaizen template is very simple to understand and easy to implement. this kaizen sheet has very simple nomenclature, those are normally used in manufacturing industries. for a better understanding, you can refer to the above filled-up kaizen sheet/ report.

kaizen template

Kaizen Sustenance Checking Methods:

Implementation of kaizen is important but sustenance of the kaizen is very important, so you can follow the below steps to check the sustenance of kaizen.

  • List out the monthly kaizen for your work zone.
  • create a Team.
  • Do at least half yearly kaizen sustenance audit
  • If possible then, link the kaizen with the daily manufacturing operation check sheet.
  • Incorporate the kaizen-poka yoke in the control plan and do the periodic test.

Thank you so much for visiting Techiequality.com

Popular Post:

CAPA Process with Example

CAPA Process

CAPA Process | Examples

Hi readers, here we are going to discuss the details of the CAPA Process and the ISO standard requirement of concept capa and also describe here with definition and comparison with the new ISO 9001:2015 and IATF 16949:2016 Standard.. as we know the capa word is common in the industry and used for improvement purposes.

Definition of CAPA:

The full Form of CAPA is Corrective Action and Preventive Action. Action to eliminate the root cause of Non-conformity is called Corrective Action. Preventive action is the action to eliminate the potential cause of non-conformity.

Download the Correction and Corrective Action Format/Template.

 Concept of CAPA Process in ISO 9001:2015:

According to the new standard ISO 9001:2015, there is no separate clause or sub-clause of preventive action. So now in ISO 9001:2015, preventive action is expressed through the use of risk-based thinking.

CAPA is the combination of two major parts one is Preventive action in the form of Risk, a mitigation plan, and current controls. And another is Corrective Action which has a separate main clause in ISO 9001:2015 Standard in Clause no 10.2.

 The main clause 10.2[
Non-conformity and corrective action] has described as

-The organization shall react to non-conformity and will take action to control and correct it.

It means basically asking for the action plan to element the root cause of non-conformity and evaluation of consequence and effectiveness of action and also asking for updating the risk and opportunity.

In the sense of CAPA in ISO 9001:2015 we have to retain documented information as evidence of [1] the Nature of non-conformity and subsequent action taken [2] Results of corrective action [3] Risk Register [4] Current control[5] Mitigation plan of significant risk.

Download the Correction and Corrective Action Format/Template.

Download the CAPA Format/Template.

Similarly Concept of the CAPA Process in IATF 16949:

The concept of CAPA w.r.t IATF 16949 is the combination of ISO 9001:2015 requirements along with the supplemental requirements of IATF 16949 as [1]Problem-solving [2] Error-Proofing [3] warranty management system [4] customer complaint and field failure test analysis.

Let us understand the supplemental requirements very well. In the section on Problem-solving, Correction, corrective action, containment action, root cause analysis, and effectiveness of corrective action need to be formulated. And also asking to update your PFMEA, DFMEA, and Control plan [if required].  And also similarly asking about the correction, corrective action, and effectiveness of action taken on warranty products, customer complaints, and field failure.                          

Let us take an example here to explain details about the Correction and corrective action:

Say, for example, Customers found damaged products at their end.

So here on the basis of the above complaint, OEM-Automotive Company may ask for 8D. Similarly for this problem, other companies can ask for a correction and corrective action plan. so first of all we will talk about correction, corrective action, containment action, and then document updation.

Containment/Correction Action: Immediately all products should be rechecked at the Dispatch Area before supply to the customer.

Corrective action: Here we need to identify the Root cause of Non-conformity by why-why analysis

Why- 1-Why Damage the product at the customer end?

Ans.- Due to the loose Packaging.

Why-1-Why Loose Packaging?

Ans.- Due to missing out of buffer element

Why –Why missed out of the buffer element?

Ans.- There was not 100% visual inspection to identify such a problem.

Action Plan: 100% Visual inspection will be executed before final packaging.

Document Updation: Control plan, PFMEA.

With the help of the CAPA (Corrective Action & Preventive Action) process, you can improve your process.

More on TECHIEQUALITY
Six Sigma Green Belt Test Questions

Six Sigma Green Belt Test Questions | 60+ Q&A with Example and Concept

Six Sigma Green Belt Test Questions | 60+ Q&A with Example and Concept Hi Readers, Today, we will be discussing …
AI in Manufacturing Industry

AI in Manufacturing Industry | What to upskilled w.r.t AI

AI in Manufacturing Industry | What to upskilled w.r.t AI Hello readers! Today we will be discussing on AI in …
FMEA Scenario Based AI Questions

FMEA Scenario Based, AI Questions and Answers

FMEA Scenario Based AI Questions and Answers Hi Readers, Today, we will be discussing an important topic on FMEA Scenario …
spc interview questions

50+ SPC Interview Questions with Answers (Beginner to Advanced) | AI in SPC

SPC Interview Questions (50+) with Answers + AI in SPC Hi Readers, Today, we will be discussing an important topic …
qa interview questions

Common QA Interview Questions with Answers

QA Interview Questions with Answers | scenario-based, AI+Quality Hi Readers, today we will be discussing an important topic that is …
Business & Operational Excellence in Startups

How to Implement Business & Operational Excellence in Startups

How to Implement Business & Operational Excellence in Startups Hi Readers! In today’s business environment, organizations try for both operational …
qc template

QC Template, Advanced Tools and Techniques

QC Template, Advanced Tools and Techniques Hi Readers, today we will be discussing on different types of QC Template, advanced …
Internal Audit

Internal Audit | Types | Types of Auditors | Manufacturing Example

Internal Audit | Types | Types of Auditors | Manufacturing Example Hi Readers, today we will be discussing an important …
Drop Down List in Excel

How to Create a Drop Down List in Excel Template with Manufacturing Example

How to Create a Drop Down List in Excel Template with manufacturing Example Hello readers! Today we are going to …
SDCA Cycle

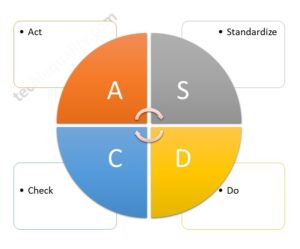
SDCA Cycle understanding with Manufacturing Example | PDCA vs SDCA

SDCA Cycle understanding with Manufacturing Example | PDCA vs SDCA Hello readers! Today we are going to discuss on SDCA …
Normal Distribution Probability

Normal Distribution Probability Formula, Calculation & Manufacturing Examples

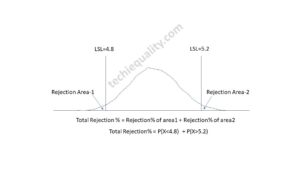
Normal Distribution Probability Formula, Calculation & Manufacturing Examples Hello readers! Today we will be discussing the normal distribution probability calculation …
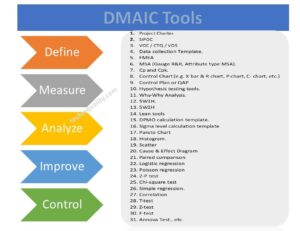
DMAIC Tools

DMAIC Tools | DMAIC Template | Six Sigma Methodologies | 30+ Free Tools

DMAIC Tools | DMAIC Template | Six Sigma Methodologies | 20+ Free Tools Hello readers! Today we are going to …
Six Sigma Project Examples

Six Sigma Project Examples | 15+ Project Examples

Six Sigma Project Examples | 15+ Project Examples Hello readers! Today we will be discussing on different types of Six …
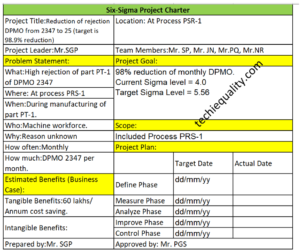
Six Sigma Project Charter Template

Six Sigma Project Charter Template

Six Sigma Project Charter Template Hello readers! Today we will discuss on a specific topic, which is related to the …
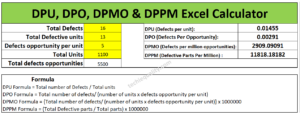
DPMO Calculation

DPMO Calculation, Formula, Template & Manufacturing Example

DPMO Calculation, Formula, Manufacturing Example & DPMO Excel Template Hello readers! Today we will be discussing on DPMO calculation with …
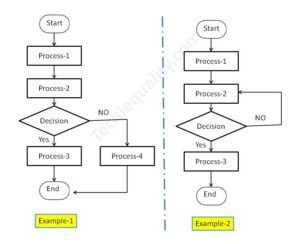
Process Flow Diagram

Process Flow Diagram Template | Examples |Symbols |PFD

Process Flow Diagram Template | Examples |Symbols |PFD Hi Readers! Here, today we will be discussing the process flow diagram, …
What is Visual Management

What is Visual Management? | Visual Management Board Examples

What is Visual Management?| Visual Management Board Examples Hi Readers! Here, today we are going to discuss on what is …
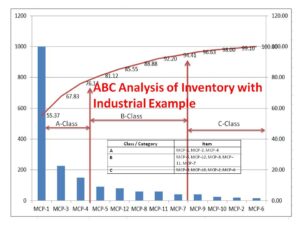
ABC Analysis of Inventory

ABC Analysis of Inventory with Industrial Example

ABC Analysis of Inventory with Industrial Example: Hi Readers! Here, we are going to discuss one of the popular inventory …
Quality Template
DOWNLOAD

Thank you for reading ……….. Keep Visiting Techiequality

Popular Post:

How to plot Histogram in Excel with Manufacturing example

How to plot Histogram in Excel

How to plot Histogram in Excel with Manufacturing Example

How to plot Histogram in Excel, Step-by-step guidance is described below

A histogram is one of the 7QC tools and commonly used graphs to show frequency distribution. Helps summarize data from a process that has been collected over a period of time.

A histogram is a representation of the frequency distribution of numerical data. it was first familiarized by Karl Pearson. The histogram is related to merely one type of variable data. We have to calculate the interval value to represent the bins. Bins will give you an idea about how much data falls within the selected data range’s width. The histogram gives the indication that data distribution is normal, skewed, or bi-modal.

Advantages of the histogram:

  • To give an idea about data distribution.
  • Data distribution can be calculated within a short time duration.
  • Data that are normal or abnormal can be identified through the graph.

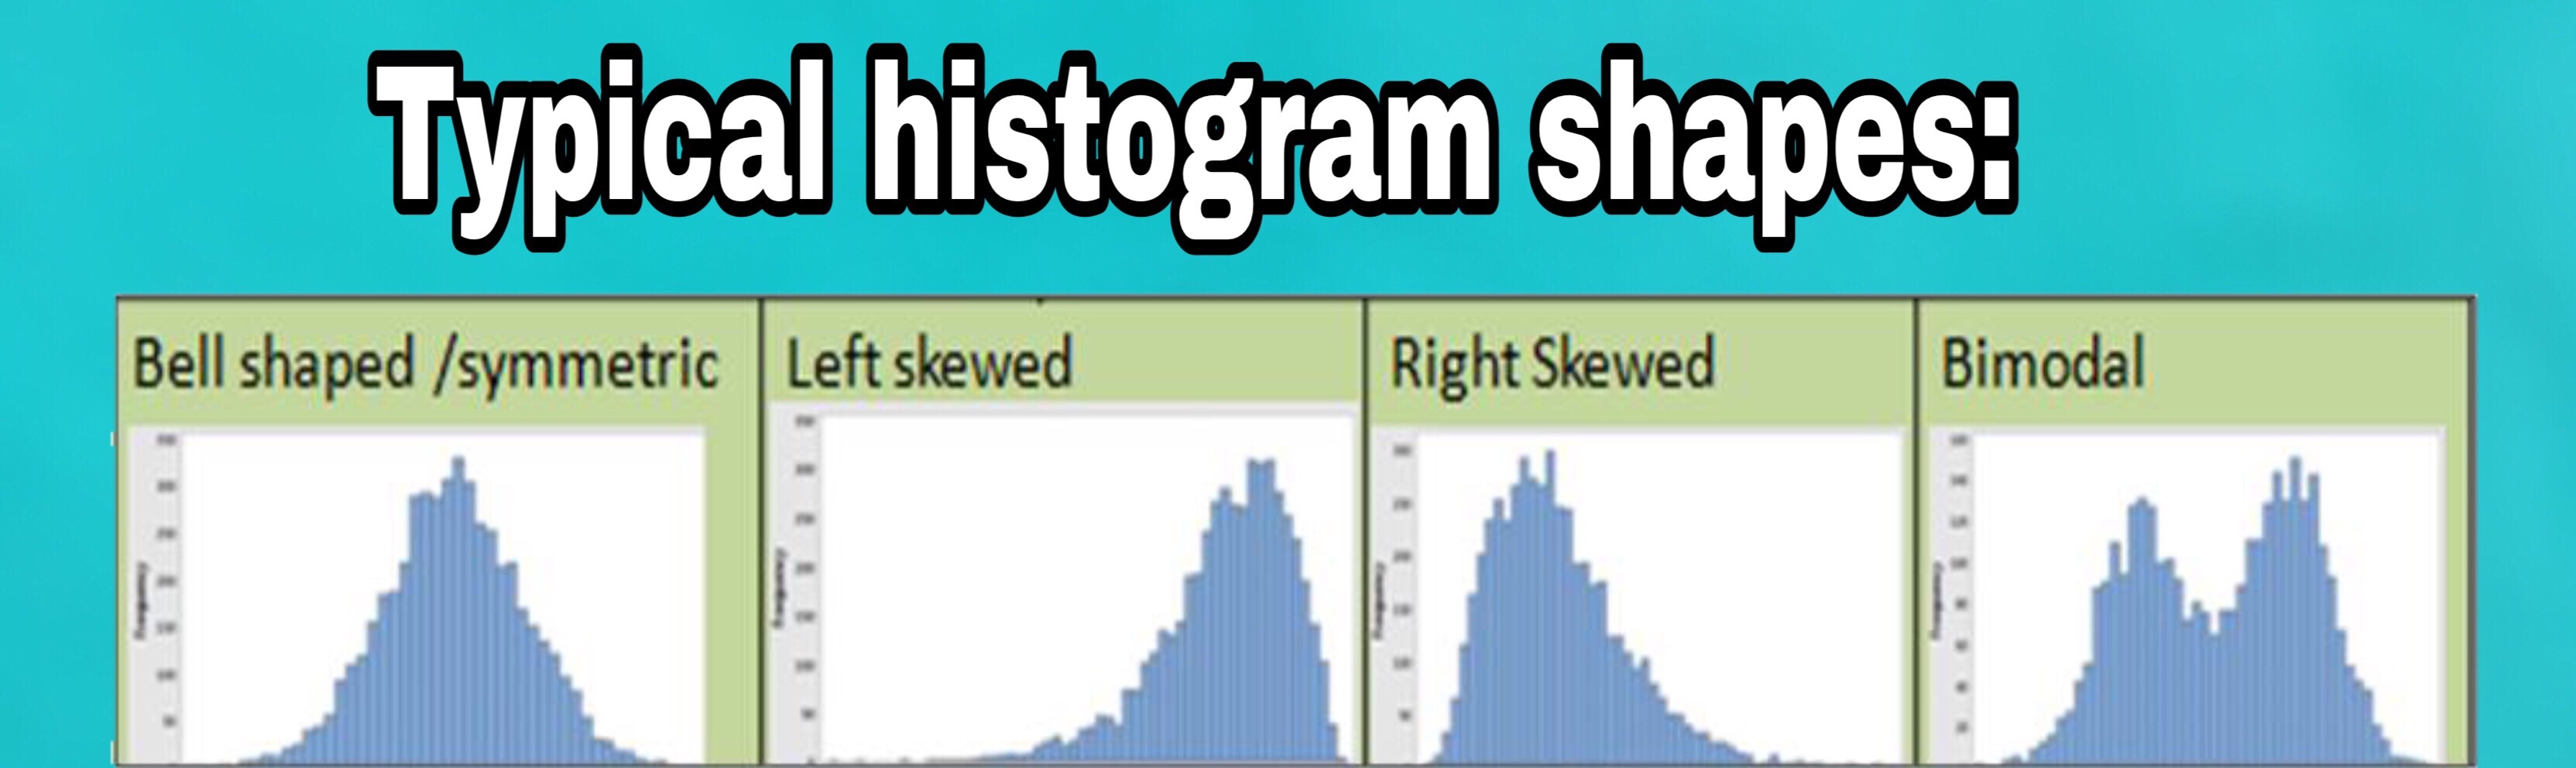
Typical histogram shapes:

1. Symmetric 2. Left skewed 3. Right skewed 4. Bimodal

Bell Shaped/Symmetric:- The data distribution shape of the left side from the average line is similar to the right-side shape, here data is normally distributed within the upper and lower specification limits, such types of data distribution are the safe sign to process operation.

Left/Right Skewed:– Generally in left or right shewed, data are distributed on one side either towards the left or right, which indicates the data are non-normal and there may chance that data can go outside of specification limits if will presence of any special cause in process or any major variation in process characteristics.

Step-by-step guidance to plot the Histogram with an example:-

Here is the full description of  How to plot a Histogram in Excel / how to make a histogram in Excel-

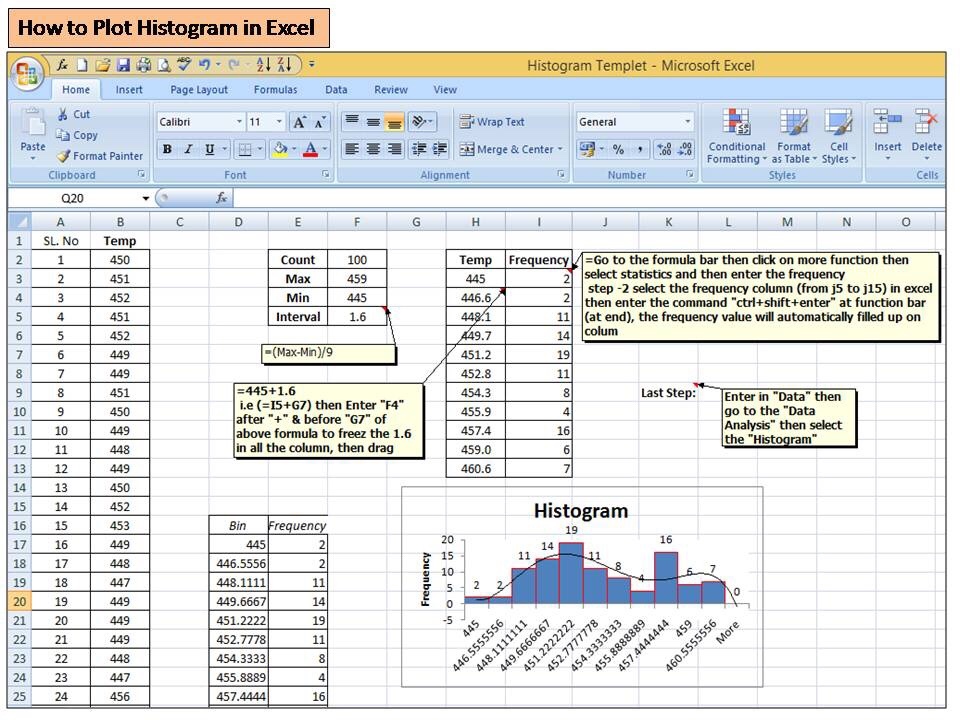
In the below temperature reading, we have 100 data but we do not know whether the data are normal or non-normal and also how many data are within the specification limit, after plotting the histogram will give you an indication of data distribution. As you can see the histogram below indicates the data distribution within the bin range.

Step -1

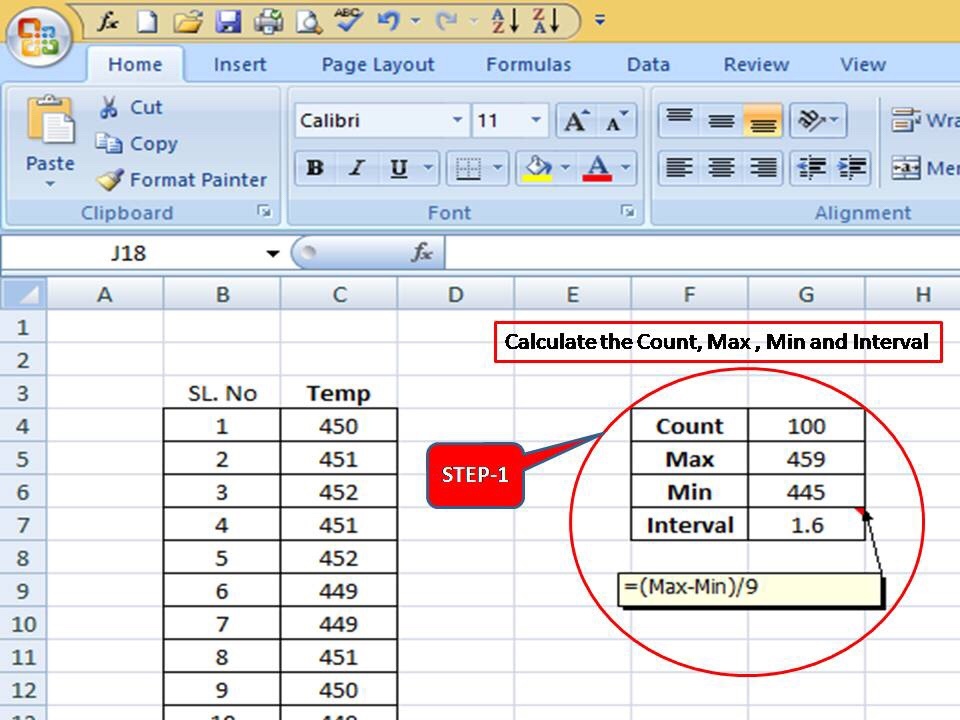
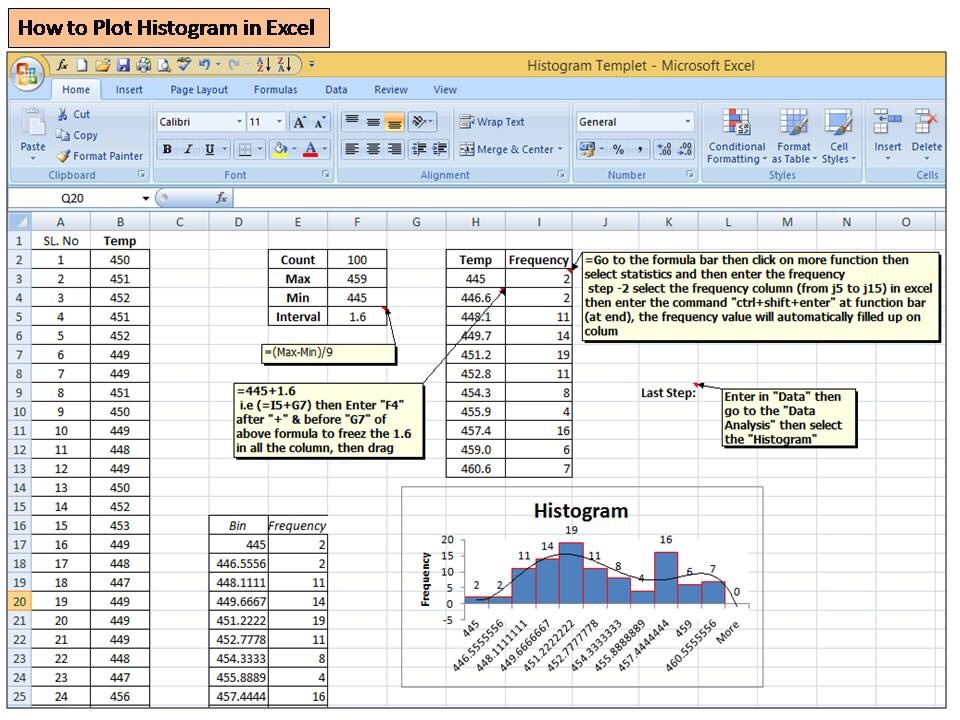
Let’s have 100 numbers temperature readings, so first of all, we need to calculate the count, Max, min, and interval of data as per below-

you can use the Excel formula to calculate the count, Max, and Min. value

(Interval =(max-Min)/9)

Step -2

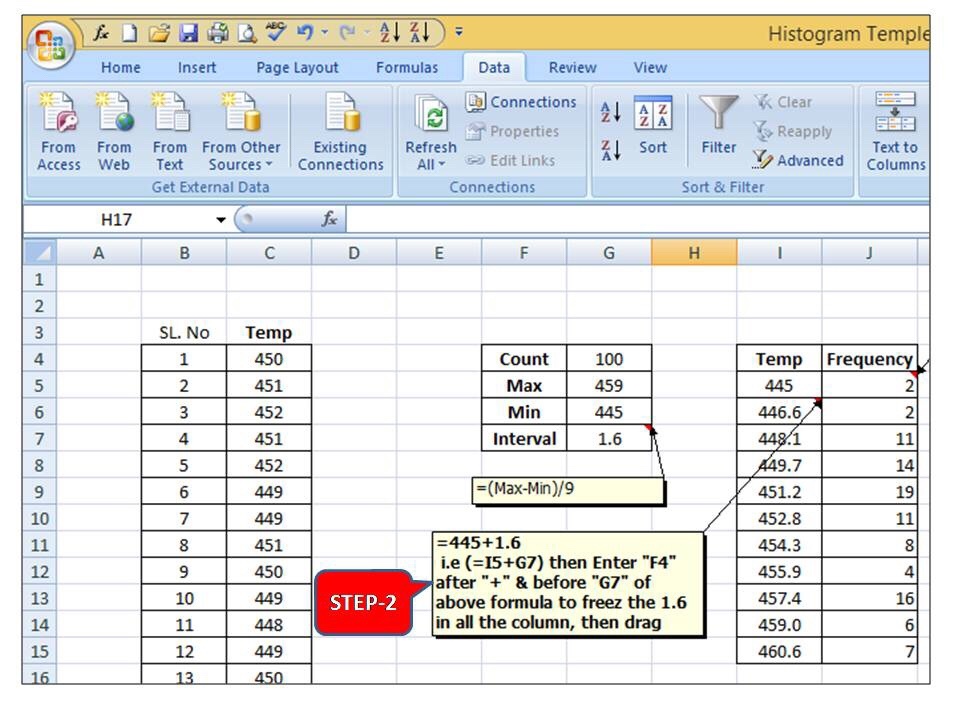
Now you have to calculate the Bin range of Temp as per the below steps

(445+1.6 I.e (=I5+G7) then enter the “F4” key after “+” & before “G7” of the above formula to freeze the 1.6 interval value in all the columns, then drag )

Step-3

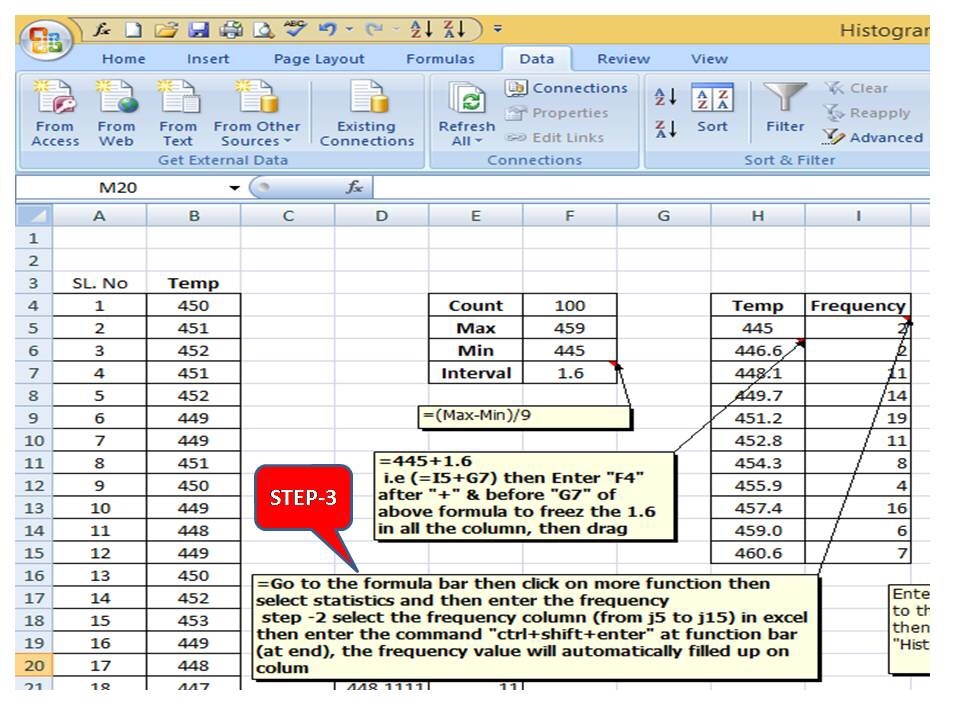
In step -3 you have to calculate the frequency distribution w.r.t temperature bin range, just follow the step 3 explanation in the Excel sheet.

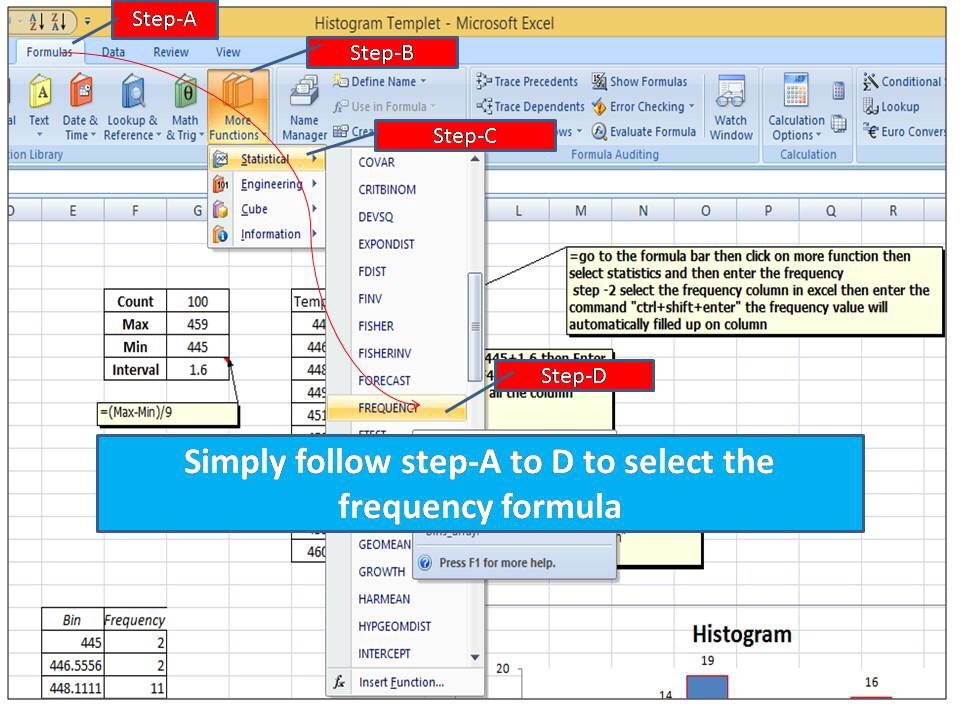
To get the frequency formula in Excel you may follow the below-

( go to the formula then more functions next to statistical then frequency and finally enter frequency)

How to plot Histogram in Excel
Step-4

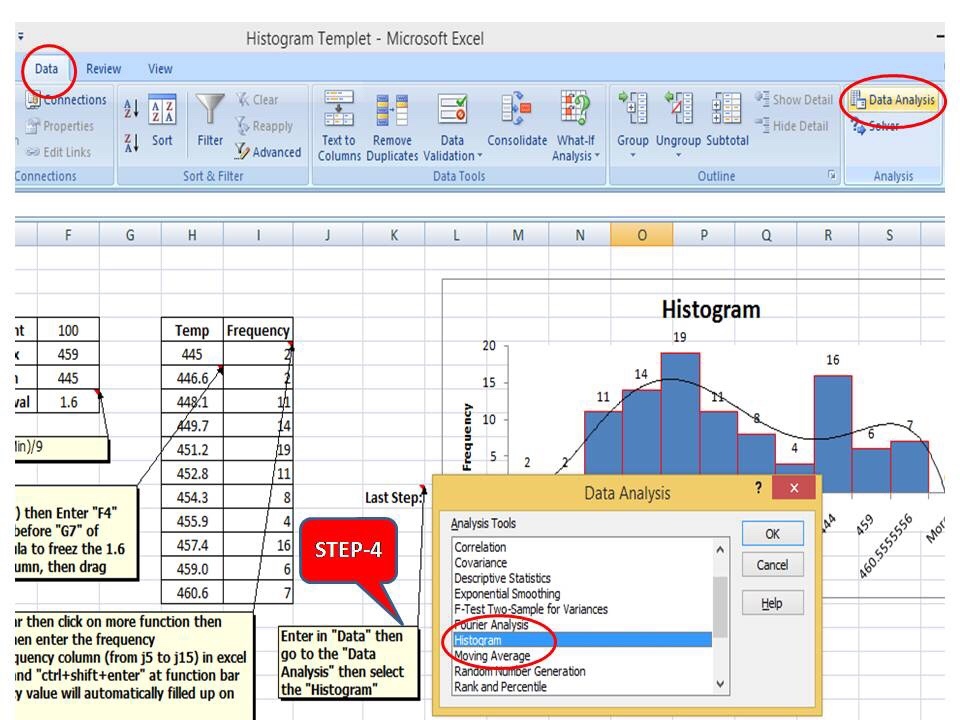
Go to the data section then the data analysis bar and select the histogram

How to plot Histogram in Excel
Step-5

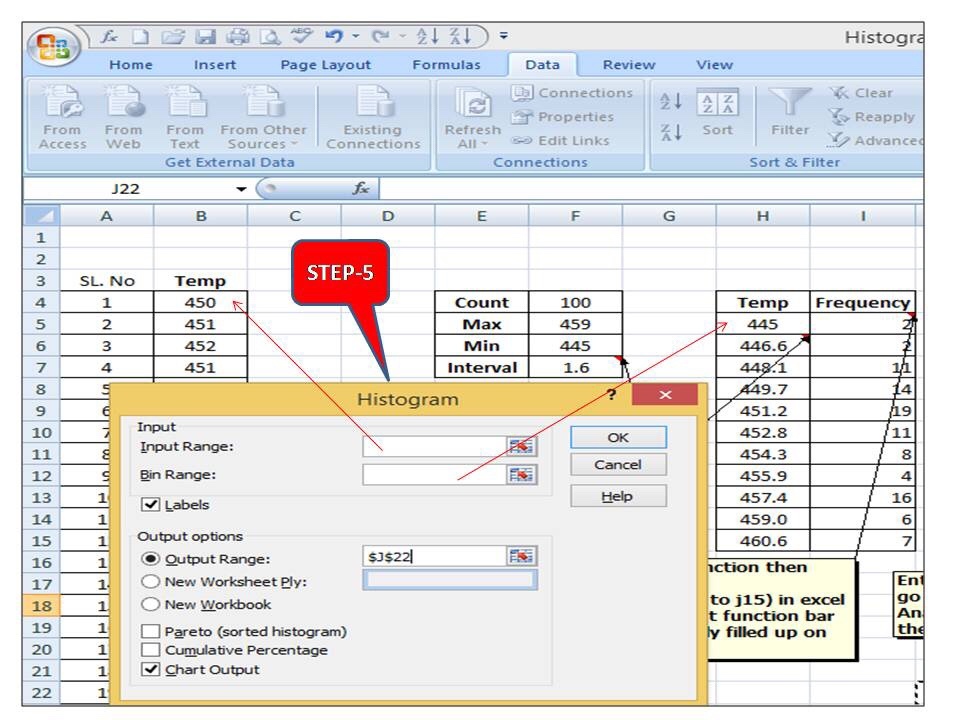
After selecting the histogram from the data analysis bar, such a dialogue box will appear, now you have to select the Input range ( select the whole temperature reading ) then select the temperature bin range as described in the arrow as per step -5, and finally enter the ok after selecting the output range( for output range you have to select at any point in excel where you would like to see the graph may be in the same sheet or in new excel sheet)

How to plot Histogram in Excel

Now the final histogram will look like this as

How to plot Histogram in Excel

If you are not getting the data analysis option in your Excel sheet, then you have to install it in the Excel sheet. we have already written the post on it, if you would like to learn the steps then, read the articles.

as we know the histogram plays a vital role in data analysis and with the help it you can easily understand the frequency distribution and different shapes like Symmetric, Left skewed, Right skewed & Bimodal, etc. and it is frequently used as one of 7 QC tools in manufacturing industries for process improvement.

Histograms are used in many activities like QA analysis, the Six Sigma project, Kaizen, SGA, Quality circle projects, etc.

Thank you for your Support and Cooperation. Keep Visiting Techiequality.Com

Popular Post: