ABC Analysis of Inventory with Industrial Example:
Hi Readers! Here, we are going to discuss one of the popular inventory management systems, which is nothing namely called ABC Analysis of Inventory. As you know that in the industry managing stock of raw materials, bop, WIP, semi-finished products, and the finished product is a matter, if you don’t have any control over inventory then a huge amount of product or material stock, Space consumption, and money consumption for a certain period will be there. That-why proper inventory control or management should be there in place so that you can get the benefit from low inventory costs.
Free Download of Quality Template / Format
Benefits of Inventory management or control:
- Low Inventory Cots
- Preventing stock issues
- Better space control
- Eliminates duplication in ordering
- Better utilization of stocks
- Reduces stock holding costs
To achieve maximum benefits with minimum efforts, it is essential to manage inventory control, so here, we are going to discuss the step-by-step process of abc analysis of inventory control.
ABC Analysis of Inventory with Industrial Example:
ABC analysis classifies a large number of items in inventory into three categories- A-class, B-class, and C-class items. The classification is based on annual usage in value. ABC analysis aims to reduce the cost of managing inventory by controlling the inventory of a few high-value items. The abc analysis technique is based on the Pareto chart law. A higher contribution of annual usage is because of low items. These high annual usage inventory values should be paid more attention.
| Class or Category | Annual Usage (Not limited to) |
| A-Category | 70-80% |
| B-Category | 15-25% |
| C-Category | 5% |
ABC Analysis Example:
For example, the Maintenance department of ABC Limited has recorded the annual usage unit of machine maintenance parts as below for doing the ABC analysis and categorizes the items into A, B & C for better inventory control and minimizing the inventory carrying costs.
| Item | Annual Usage Unit | Unit Cost in $ |
| MCP-1 | 5000 | 200 |
| MCP-2 | 800 | 25 |
| MCP-3 | 1500 | 150 |
| MCP-4 | 2500 | 60 |
| MCP-5 | 3000 | 30 |
| MCP-6 | 900 | 18 |
| MCP-7 | 2000 | 20 |
| MCP-8 | 1200 | 50 |
| MCP-9 | 1000 | 40 |
| MCP-10 | 1300 | 19 |
| MCP-11 | 600 | 100 |
| MCP-12 | 2000 | 40 |
ABC Analysis of Inventory Steps by Steps Calculation:
Step-1: Calculate the annual usage cost by multiplying the quantity of each item with their respective price.
| Item | Annual Usage Unit | Unit Cost in $ | Annual Usage Cost ($) |
| MCP-1 | 5000 | 200 | 1000000 |
| MCP-2 | 800 | 25 | 20000 |
| MCP-3 | 1500 | 150 | 225000 |
| MCP-4 | 2500 | 60 | 150000 |
| MCP-5 | 3000 | 30 | 90000 |
| MCP-6 | 900 | 18 | 16200 |
| MCP-7 | 2000 | 20 | 40000 |
| MCP-8 | 1200 | 50 | 60000 |
| MCP-9 | 1000 | 40 | 40000 |
| MCP-10 | 1300 | 19 | 24700 |
| MCP-11 | 600 | 100 | 60000 |
| MCP-12 | 2000 | 40 | 80000 |
Step-2: Rearrange the above items in descending order (largest to smallest).
| Item | Annual Usage Unit | Unit Cost in $ | Annual Usage Cost (xK$) |
| MCP-1 | 5000 | 200 | 1000 |
| MCP-3 | 1500 | 150 | 225 |
| MCP-4 | 2500 | 60 | 150 |
| MCP-5 | 3000 | 30 | 90 |
| MCP-12 | 2000 | 40 | 80 |
| MCP-8 | 1200 | 50 | 60 |
| MCP-11 | 600 | 100 | 60 |
| MCP-7 | 2000 | 20 | 40 |
| MCP-9 | 1000 | 40 | 40 |
| MCP-10 | 1300 | 19 | 24.7 |
| MCP-2 | 800 | 25 | 20 |
| MCP-6 | 900 | 18 | 16.2 |
Step-3: Calculate the cumulative annual usage cost:
| Item | Annual Usage Unit | Unit Cost in $ | Annual Usage Cost (xK$) | Cum. Annual Usage Cost (xK$) |
| MCP-1 | 5000 | 200 | 1000 | 1000 |
| MCP-3 | 1500 | 150 | 225 | 1225 |
| MCP-4 | 2500 | 60 | 150 | 1375 |
| MCP-5 | 3000 | 30 | 90 | 1465 |
| MCP-12 | 2000 | 40 | 80 | 1545 |
| MCP-8 | 1200 | 50 | 60 | 1605 |
| MCP-11 | 600 | 100 | 60 | 1665 |
| MCP-7 | 2000 | 20 | 40 | 1705 |
| MCP-9 | 1000 | 40 | 40 | 1745 |
| MCP-10 | 1300 | 19 | 24.7 | 1769.7 |
| MCP-2 | 800 | 25 | 20 | 1789.7 |
| MCP-6 | 900 | 18 | 16.2 | 1805.9 |
Step-4: Calculate the cumulative percentage
| Item | Annual Usage Unit | Unit Cost in $ | Annual Usage Cost (xK$) | Cum. Annual Usage Cost (xK$) | Cum. Percentage % |
| MCP-1 | 5000 | 200 | 1000 | 1000 | 55.37 |
| MCP-3 | 1500 | 150 | 225 | 1225 | 67.83 |
| MCP-4 | 2500 | 60 | 150 | 1375 | 76.14 |
| MCP-5 | 3000 | 30 | 90 | 1465 | 81.12 |
| MCP-12 | 2000 | 40 | 80 | 1545 | 85.55 |
| MCP-8 | 1200 | 50 | 60 | 1605 | 88.88 |
| MCP-11 | 600 | 100 | 60 | 1665 | 92.20 |
| MCP-7 | 2000 | 20 | 40 | 1705 | 94.41 |
| MCP-9 | 1000 | 40 | 40 | 1745 | 96.63 |
| MCP-10 | 1300 | 19 | 24.7 | 1769.7 | 98.00 |
| MCP-2 | 800 | 25 | 20 | 1789.7 | 99.10 |
| MCP-6 | 900 | 18 | 16.2 | 1805.9 | 100.00 |
Step-5: Select the category by “A” by max. 80% contribution, “B” by 25% and “C” by 5%
| Item | Annual Usage Unit | Unit Cost in $ | Annual Usage Cost (xK$) | Cum. Annual Usage Cost (xK$) | Cum. Percentage % | Class/Category |
| MCP-1 | 5000 | 200 | 1000 | 1000 | 55.37 | A |
| MCP-3 | 1500 | 150 | 225 | 1225 | 67.83 | A |
| MCP-4 | 2500 | 60 | 150 | 1375 | 76.14 | A |
| MCP-5 | 3000 | 30 | 90 | 1465 | 81.12 | B |
| MCP-12 | 2000 | 40 | 80 | 1545 | 85.55 | B |
| MCP-8 | 1200 | 50 | 60 | 1605 | 88.88 | B |
| MCP-11 | 600 | 100 | 60 | 1665 | 92.20 | B |
| MCP-7 | 2000 | 20 | 40 | 1705 | 94.41 | B |
| MCP-9 | 1000 | 40 | 40 | 1745 | 96.63 | C |
| MCP-10 | 1300 | 19 | 24.7 | 1769.7 | 98.00 | C |
| MCP-2 | 800 | 25 | 20 | 1789.7 | 99.10 | C |
| MCP-6 | 900 | 18 | 16.2 | 1805.9 | 100.00 | C |
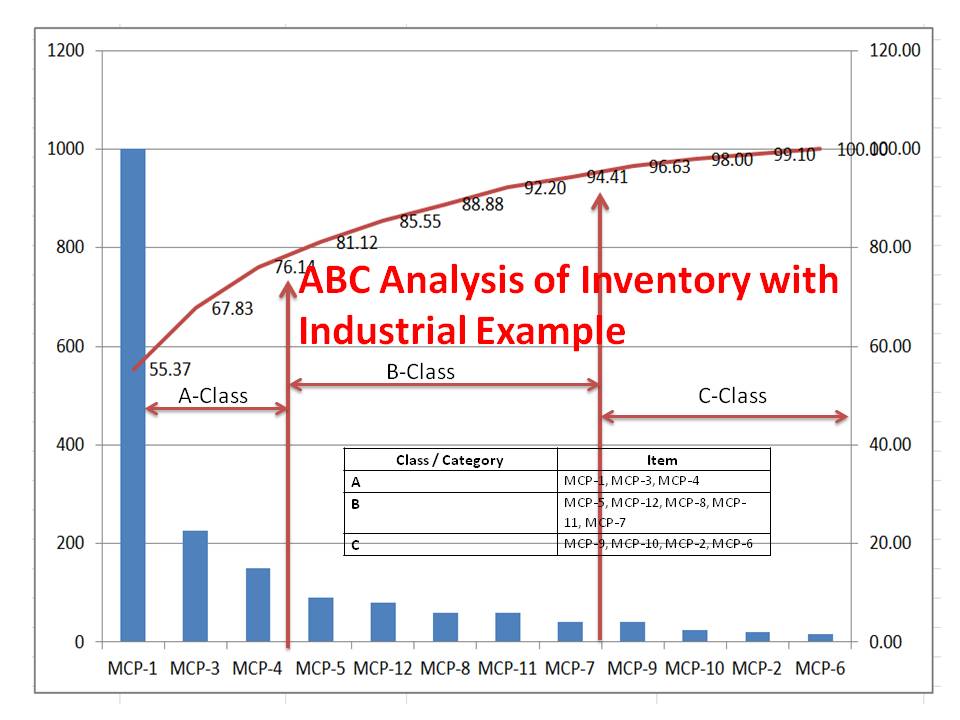
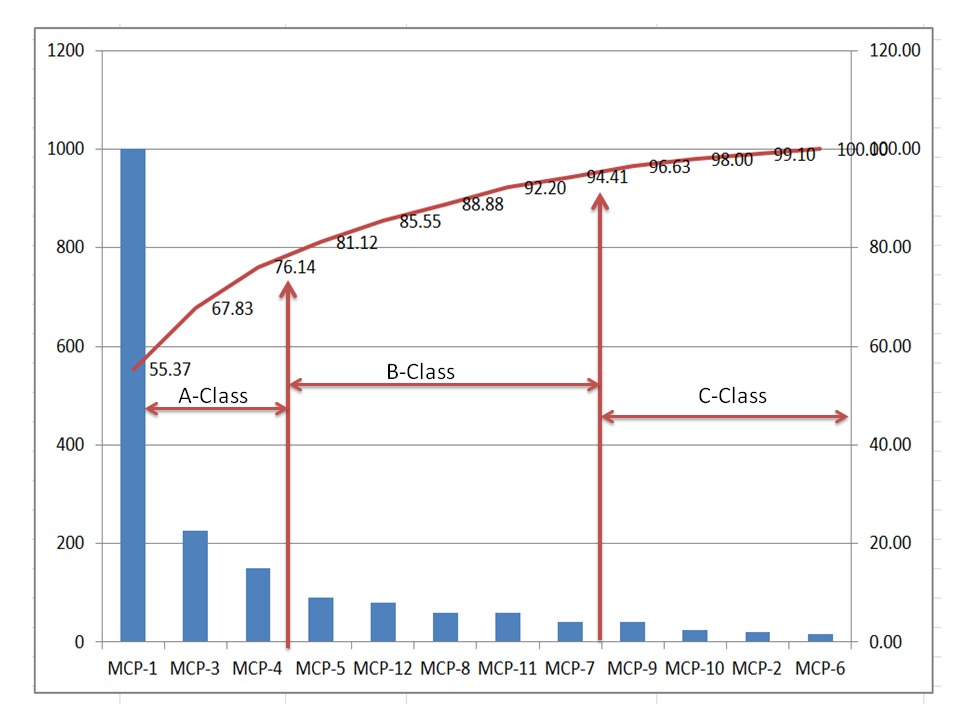
Note: Based in Cumulative percentage we have selected “A” category up to 80% contribution, “B” category from 80% to 95%, and “C” category from 95% to 100% contribution.
| Class / Category | Item |
| A | MCP-1, MCP-3, MCP-4 |
| B | MCP-5, MCP-12, MCP-8, MCP-11, MCP-7 |
| C | MCP-9, MCP-10, MCP-2, MCP-6 |
Free Templates / Formats of QM: we have published some free templates or formats related to Quality Management with manufacturing / industrial practical examples for better understanding and learning. if you have not yet read these free template articles/posts then, you could visit our “Template/Format” section. Thanks for reading…keep visiting techiequality.com


Popular Post

Shanti Gopal Pradhan is an experienced professional in Quality Management Systems, QA, Operations, Business Excellence, and Process Improvement. He has strong expertise in international standards including IATF 16949, ISO 9001, ISO 14001, ISO 45001, and ISO 17025, along with methodologies such as TQM, TPM, and Six Sigma.
He holds a degree in Mechanical Engineering along with an MBA, combining strong technical acumen with strategic business insight, he is a Certified Internal Auditor, Lead Auditor, and Six Sigma Black Belt, with a proven track record in driving quality transformation and operational excellence.