Toyota Production System History
Toyota Production System History: In the 1800s, the Toyoda family has started the first business as a textile firm but later in 1935, they began producing cars. Initially, the quality of the cars was very poor. In 1950, Eiji Toyoda visited the Ford Motor Company to learn and establish the methods of mass production in their Toyota car manufacturing plant. After months of studying the plant, Toyoda concluded that Ford’s production system was not suitable in Japan. In the US, only one type of car was produced in a plant. Toyoda would like to produce a variety of cars in just one plant. Also, Toyota Company has so many other problems as a short supply of capital that prevented him from investing heavily in modern equipment and technology and the strong Japanese company labours unions, Because of which he could not readily hire workers.
Toyota Production System Tools & Technique
Finally, Toyoda has decided that Ford production system would not be suitable for their car manufacturing company and called production engineer Taiichii Ohno to aid him in developing a workable system taking into consideration the restrictions of his company. Because of the restrictions Taiichii Ohno had to design a system that would be more efficient, less costly, and more flexible, would be less wasteful than traditional mass-production methods. The system developed by taiichii Ohno and Toyoda was later termed as “Toyota Production System”.
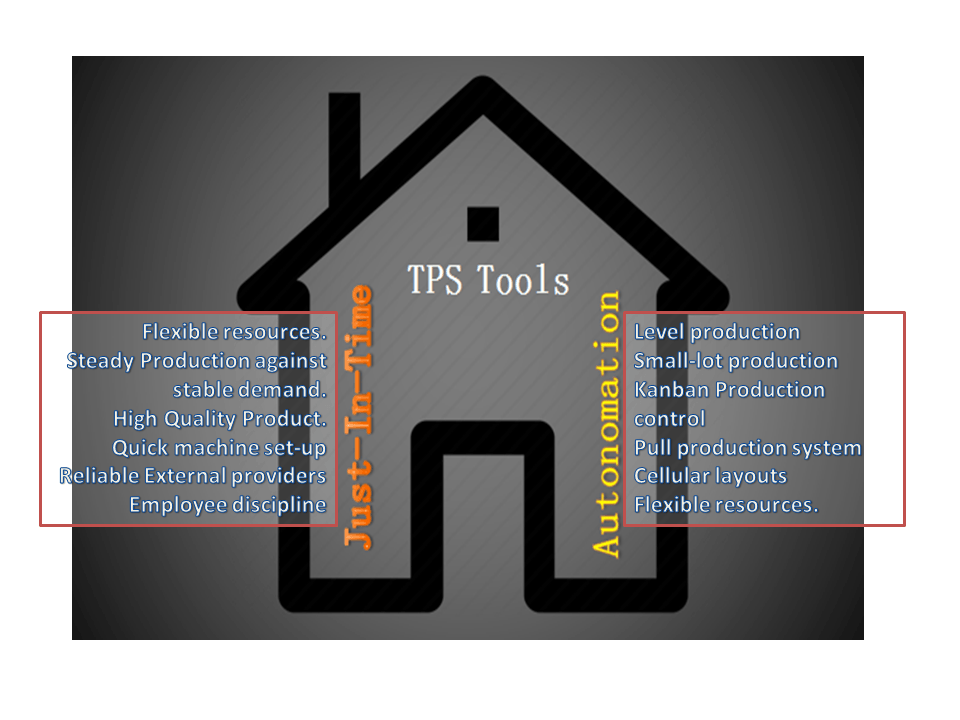
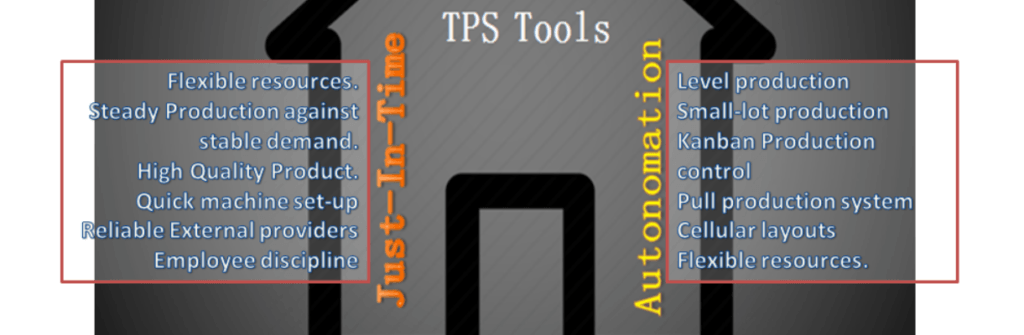
The Prototypes of the TPS (Toyota Production System” is the JIT (Just-In-Time) & Autonomation. The Objective of the JIT was to produce the necessary units in the quantities needed at the time they were needed. Just-in-time is a popular name but some companies call it as Continuous-flow manufacturing, Stockless production, management by sight, short-cycle manufacturing and time-based competition, etc.
The major elements of Just-In-Time are;
- No machine breakdowns
- Flexible resources
- Steady Production against stable demand.
- High-Quality Product.
- Quick machine set-up
- Reliable External providers
- Employee discipline
The word Autonomation means automation with human touch or autonomous defect control.
The Principles used in TPS (Toyota Production System are;
Toyota Principles
- Supplier network
- Quality at the source
- TPM
- Quick set-up
- Level production
- Small-lot production
- Kanban Production control
- Pull production system
- Cellular layouts
- Flexible resources.
- Autonomation
Useful Articles:
Error Proofing Understanding & Implementation of IATF 16949 Clauses 10.2.4
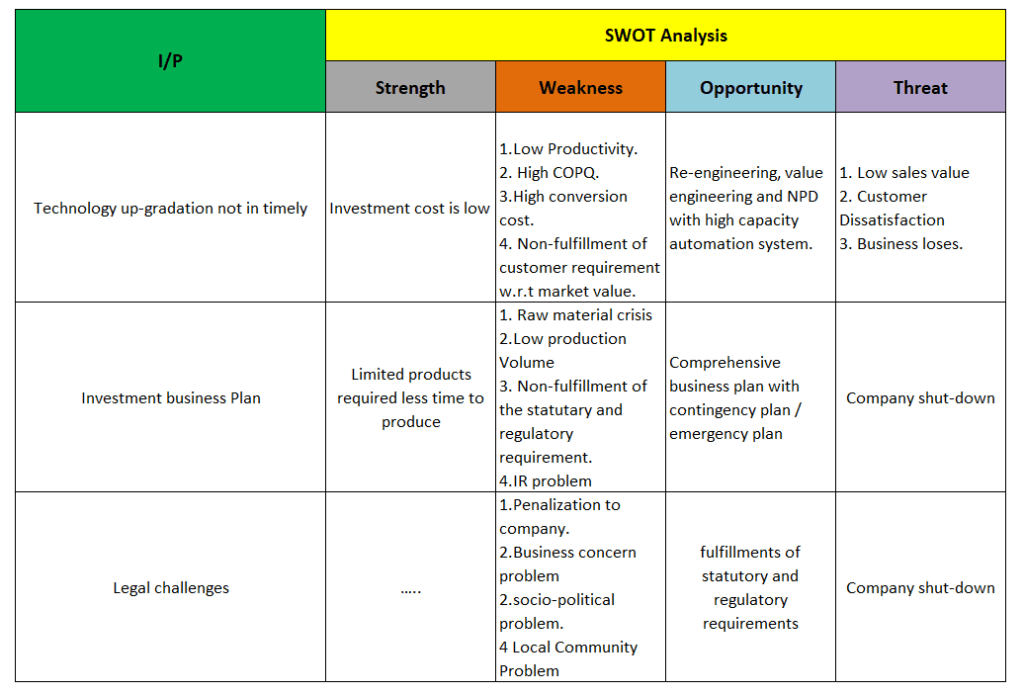
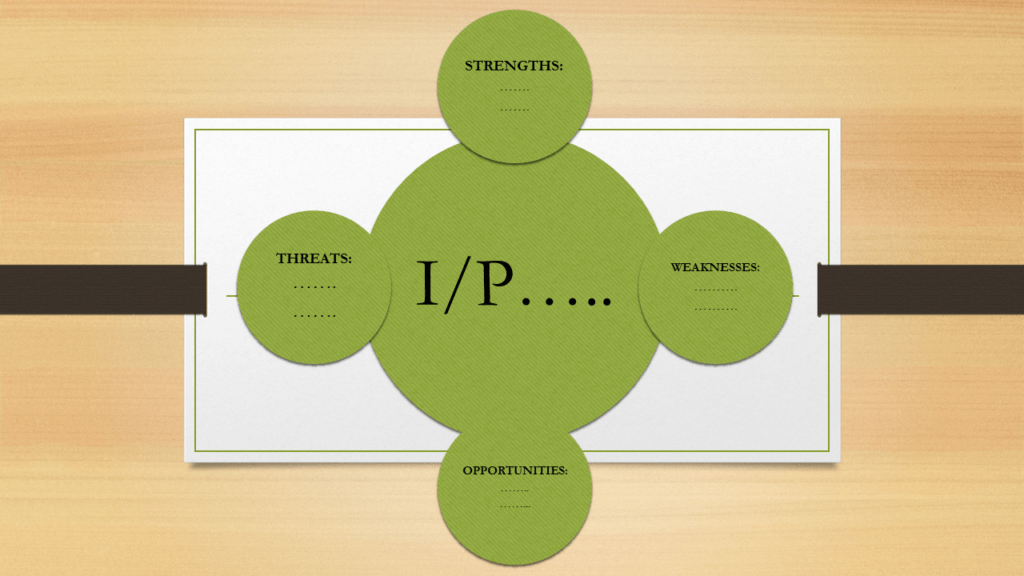
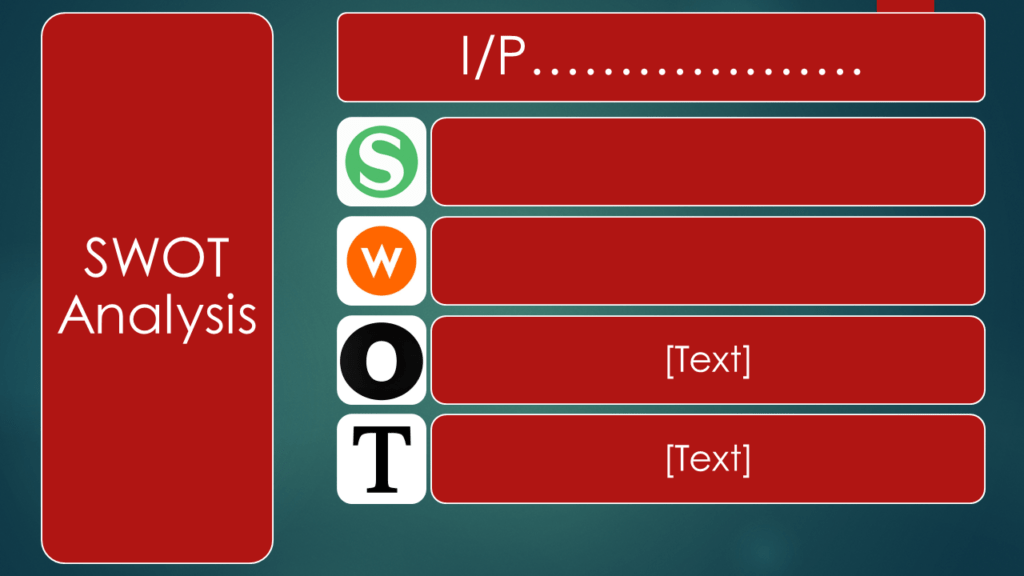
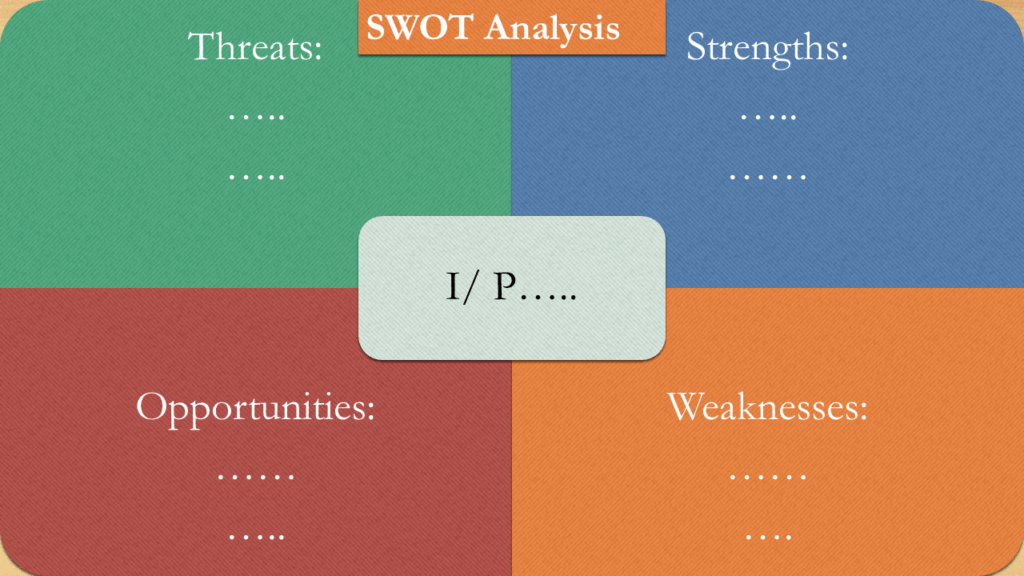
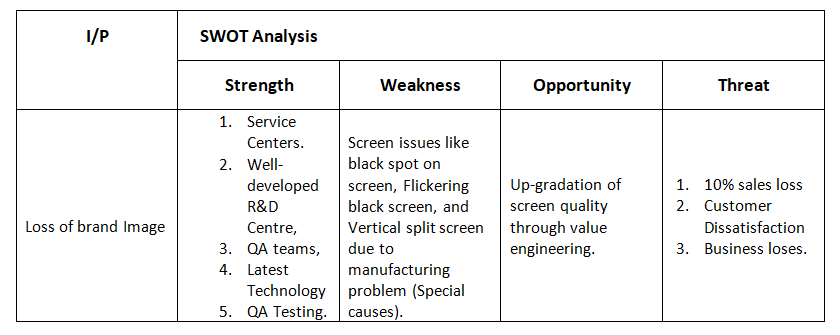
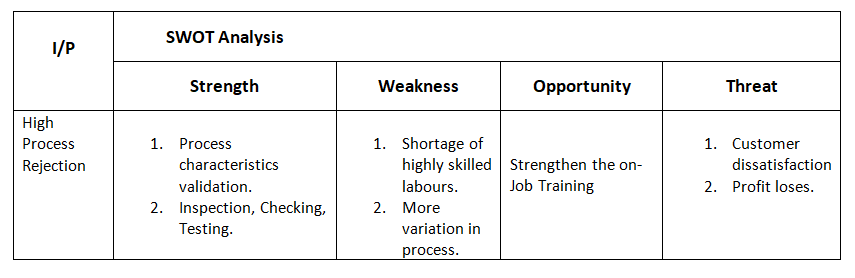
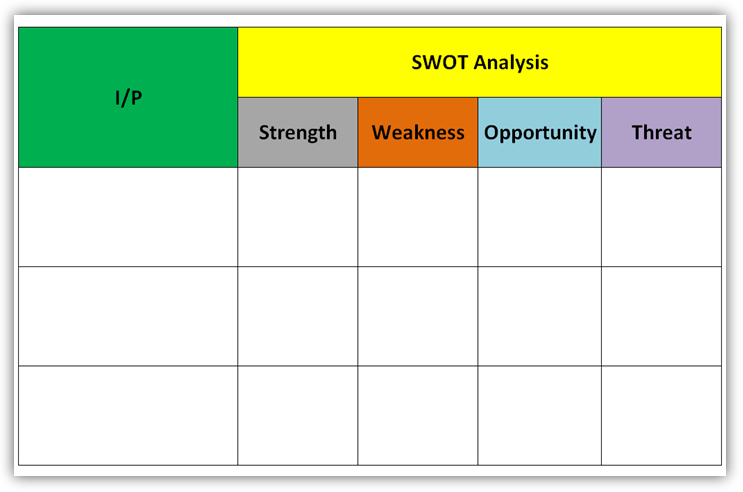
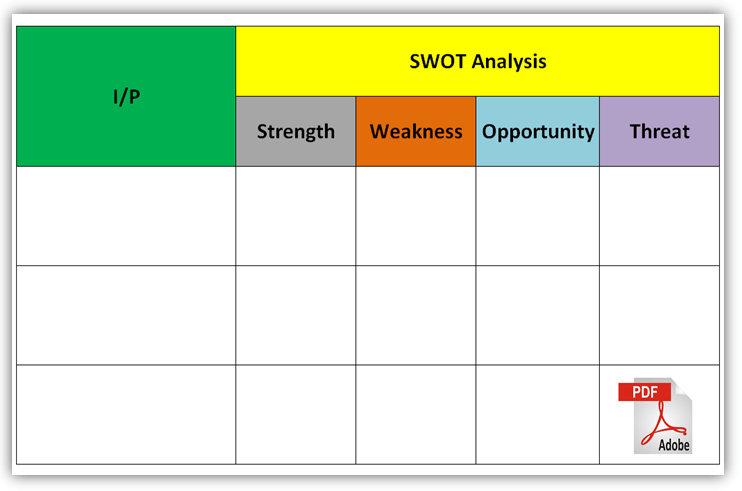
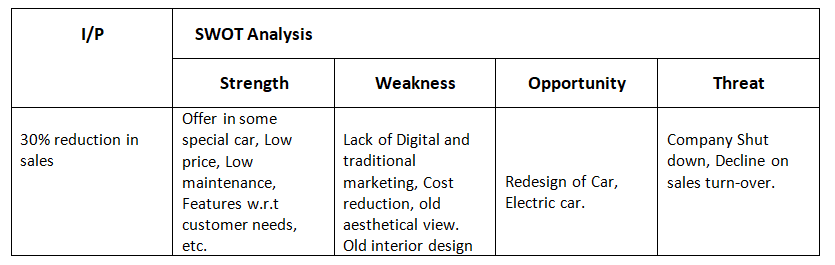
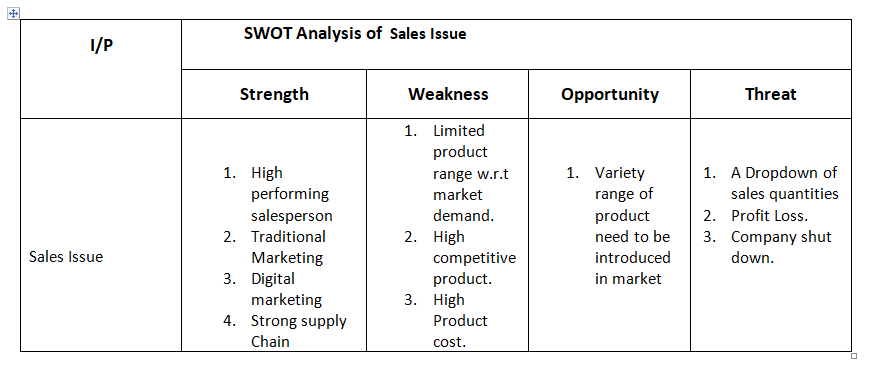
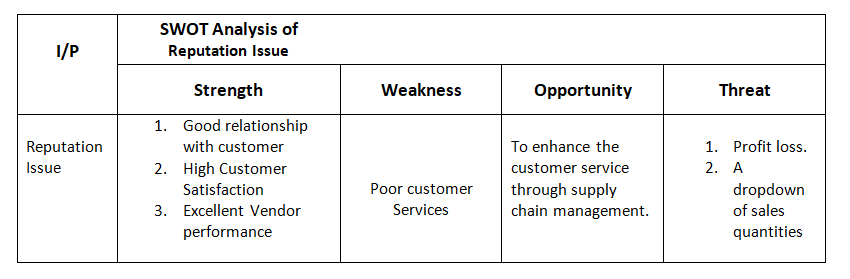
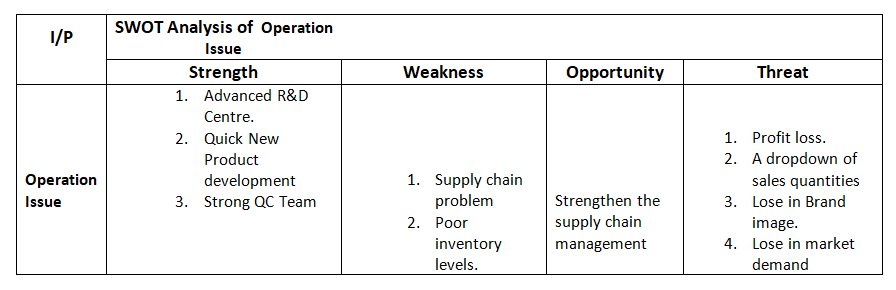
Swot Analysis of a Company Challenges
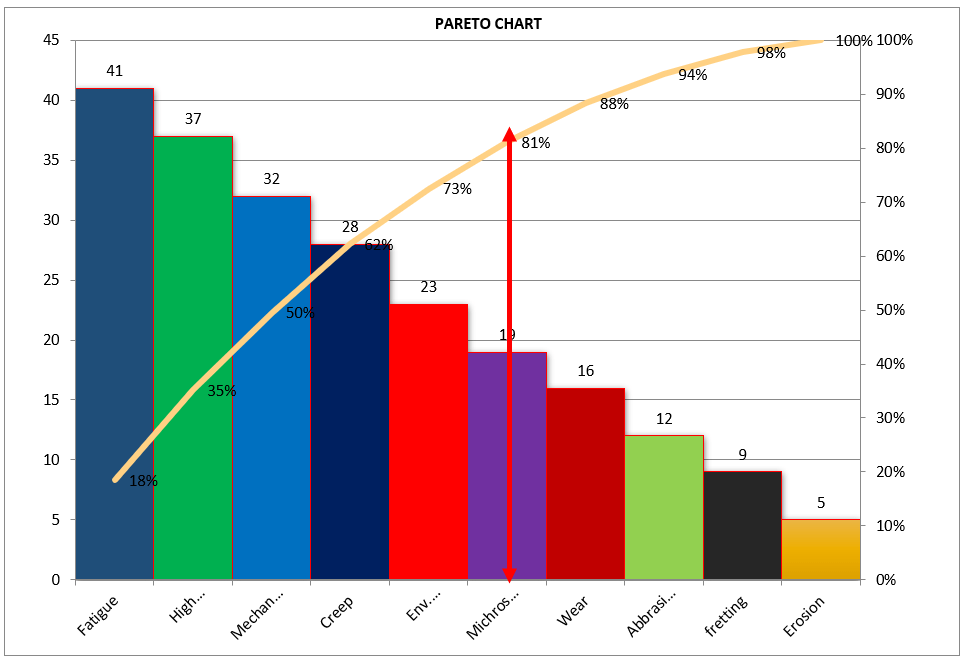
Pareto Chart Example of Manufacturing Units
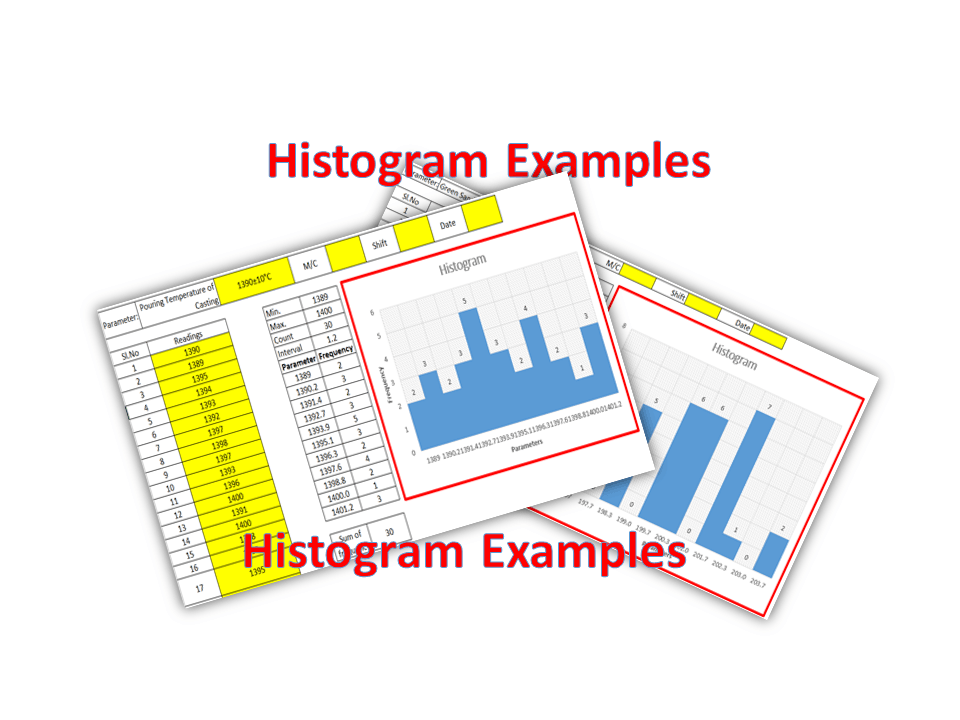
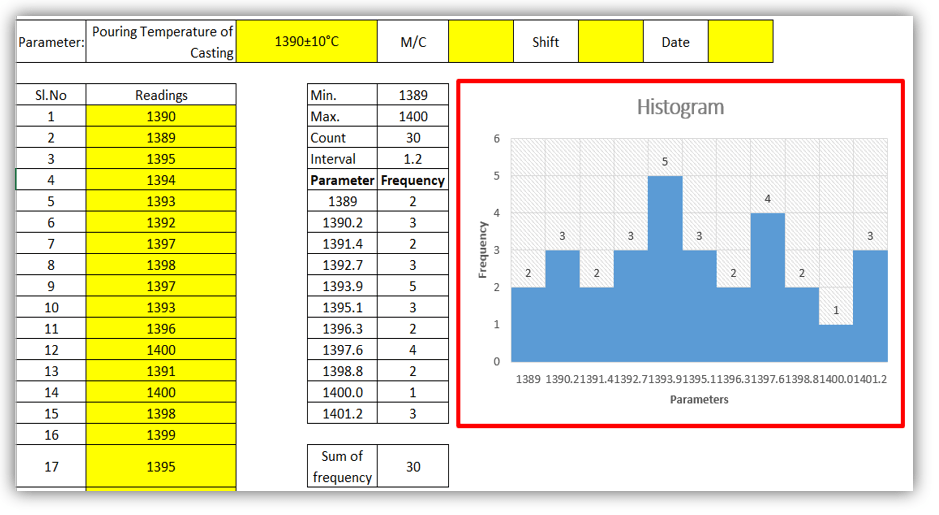
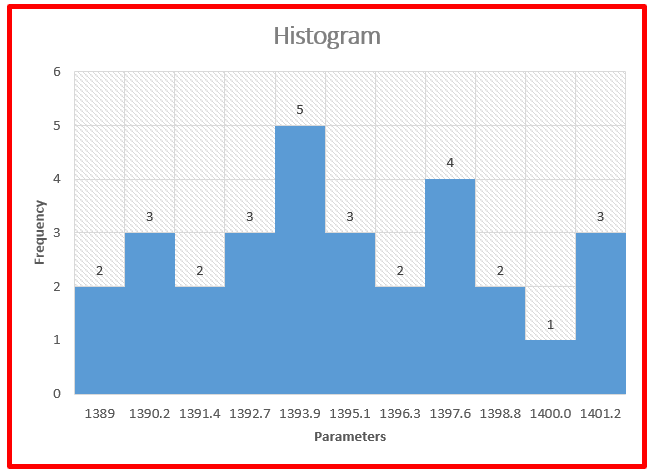
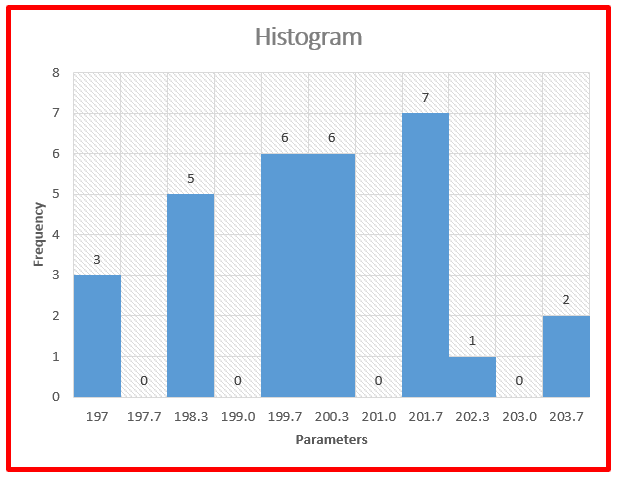
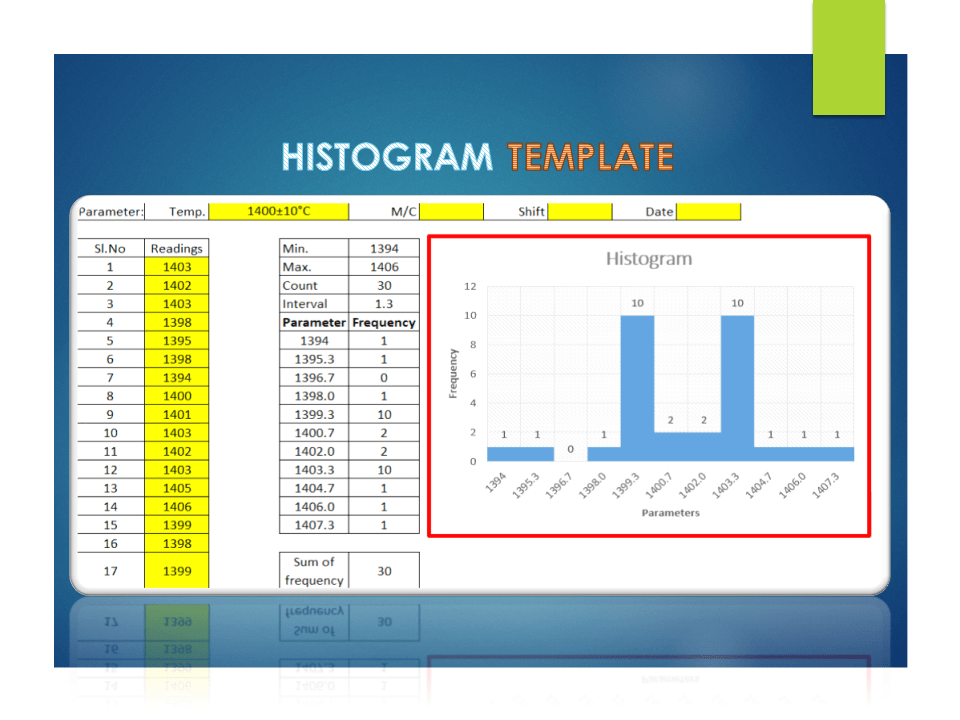
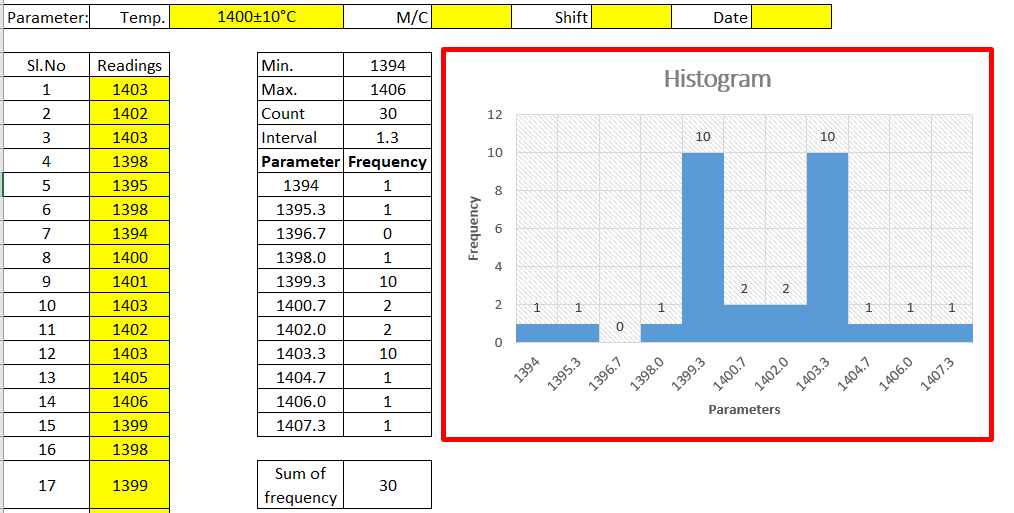
Histogram Example | Foundry Industries Examples


Thank you for reading…Keep visiting Techiequality.Com
I hope the above articles “Toyota Production System History” is useful to you…
Popular Post:

Shanti Gopal Pradhan is an experienced professional in Quality Management Systems, QA, Operations, Business Excellence, and Process Improvement. He has strong expertise in international standards including IATF 16949, ISO 9001, ISO 14001, ISO 45001, and ISO 17025, along with methodologies such as TQM, TPM, and Six Sigma.
He holds a degree in Mechanical Engineering along with an MBA, combining strong technical acumen with strategic business insight, he is a Certified Internal Auditor, Lead Auditor, and Six Sigma Black Belt, with a proven track record in driving quality transformation and operational excellence.