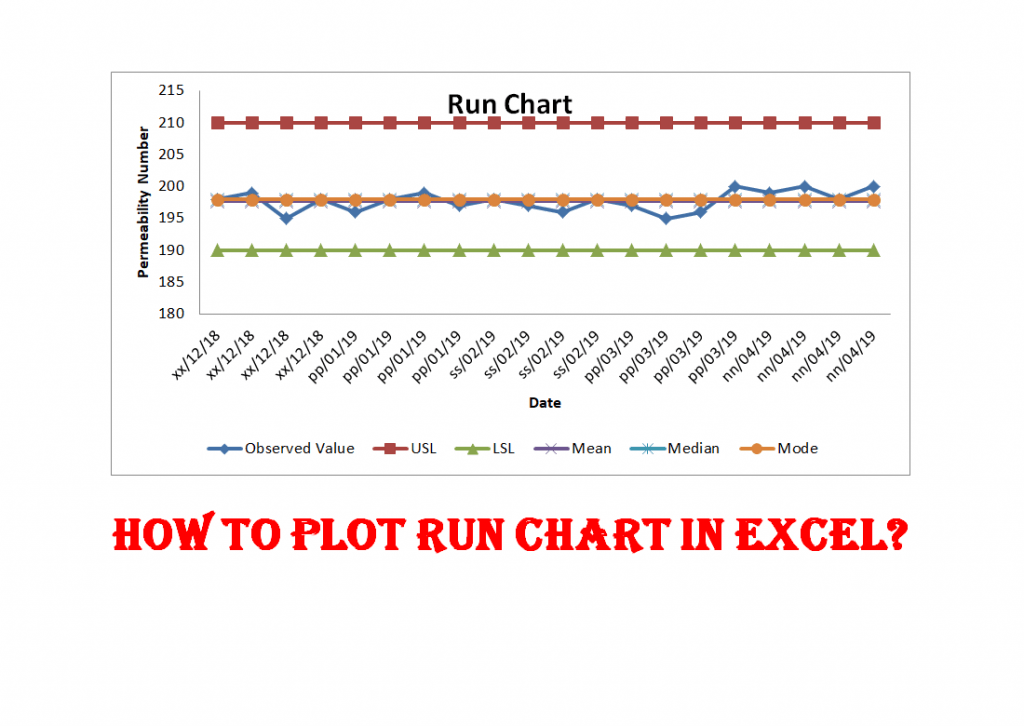
How to plot the Run Chart in Minitab
Hi Reader! Today we are going to learn how to plot a Run Chart in Minitab. A run chart is also a Line Chart. It is generally used on the shop floor to monitor the Process variation. In the run chart, you could able to set up the mean value, upper specification limit, lower specification limit, Median & mode. The Run chart will not be able to give an idea about the control limits. It represents the variation in summarizing data of Process, or Product characteristics. However, it can show you how the process is running. If you would like to download the Run Chart Excel template then click on the below link.
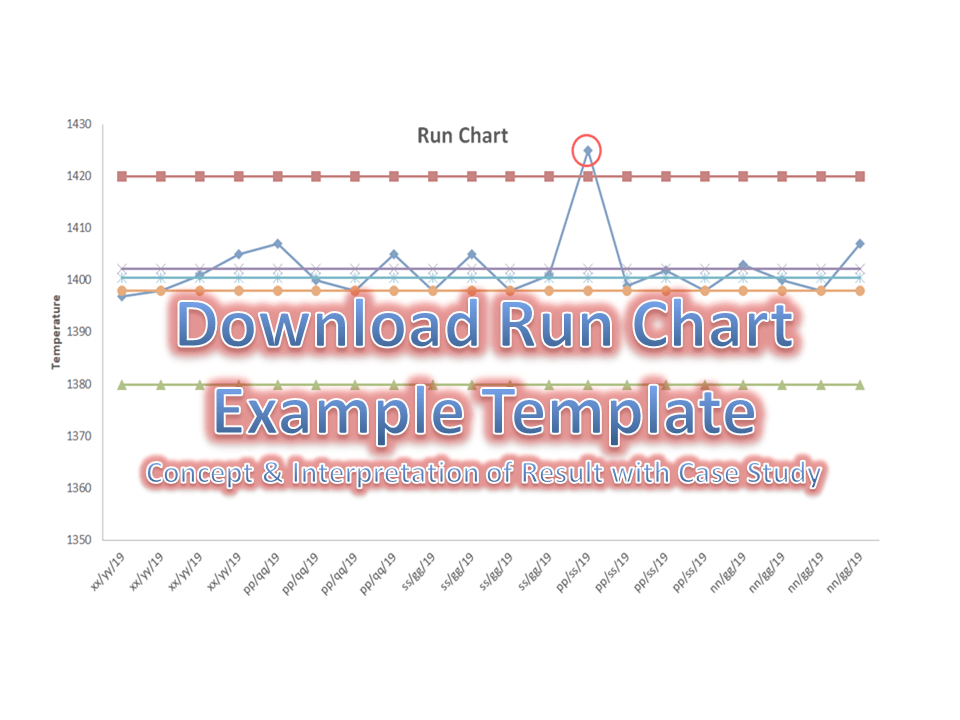
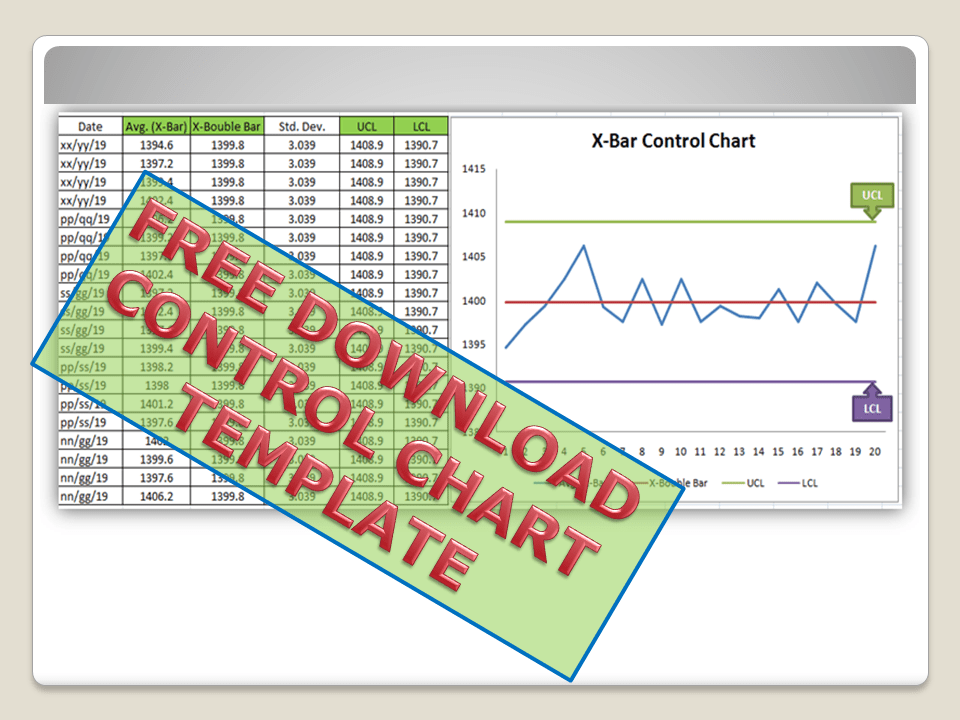
Download Run Chart Excel Template.
Step by Step guide on How to plot Run Chart in Minitab:
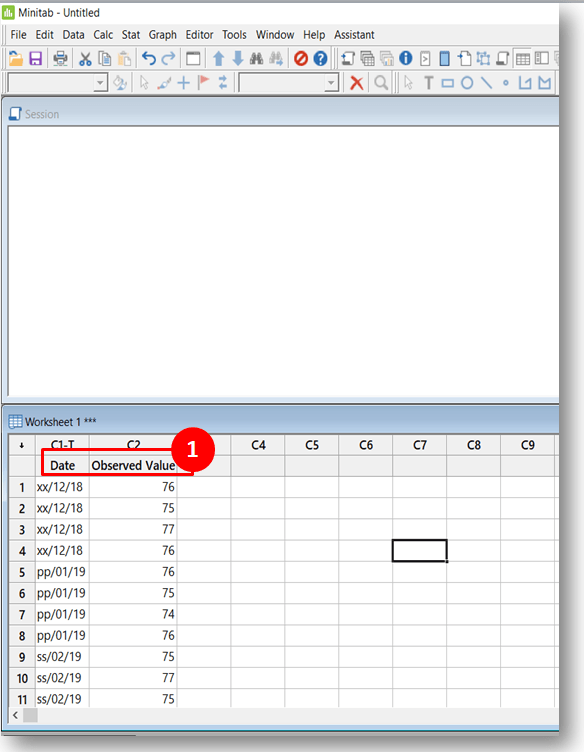
Step-1: Open the Minitab Software and enter the Reading (Observed Value).
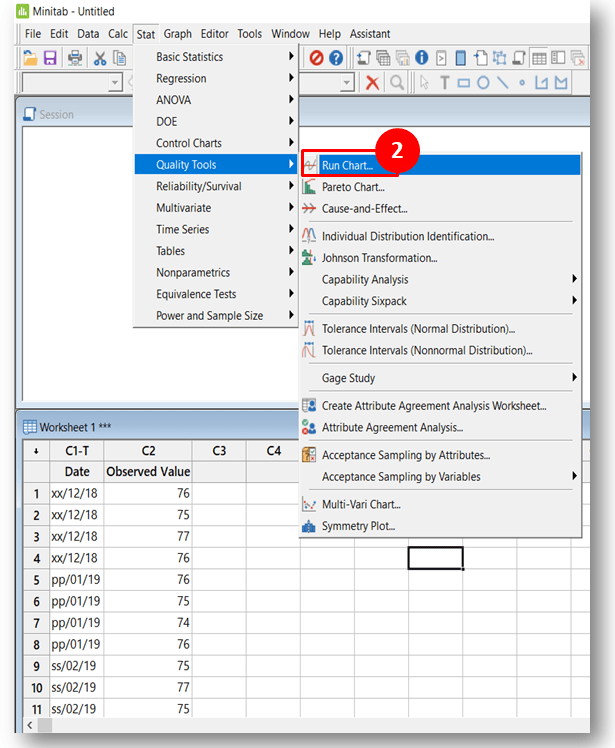
Step-2: Select the Run Chart from Minitab (Start>>Quality Tools>>Run Chart).
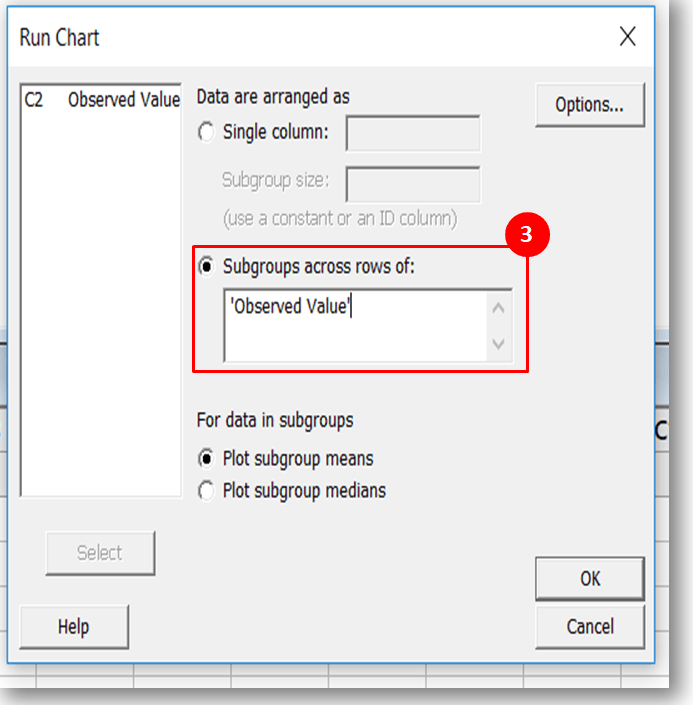
Step-3: Select the option “Subgroups across rows of”, next to click on “ok” to draw the Run Chart.
Illustration of Steps:
Step-1:
When you will open the Minitab software; the main screen will look like below. To execute the Minitab you have to enter the data in the input sheet. Please go through the below figure to understand better.
Step-2:
Select the Run Chart option in Minitab. Go to (Start>>Quality Tools>>Run Chart).
Step-3: After selecting the “Run Chart” option in Minitab, Such below type Dialog Box will appear on the screen. Next; you have to select the Option as “Subgroups across rows of” and then finally select the Column. Look into the below figure for a better understanding.
Run Chart: –
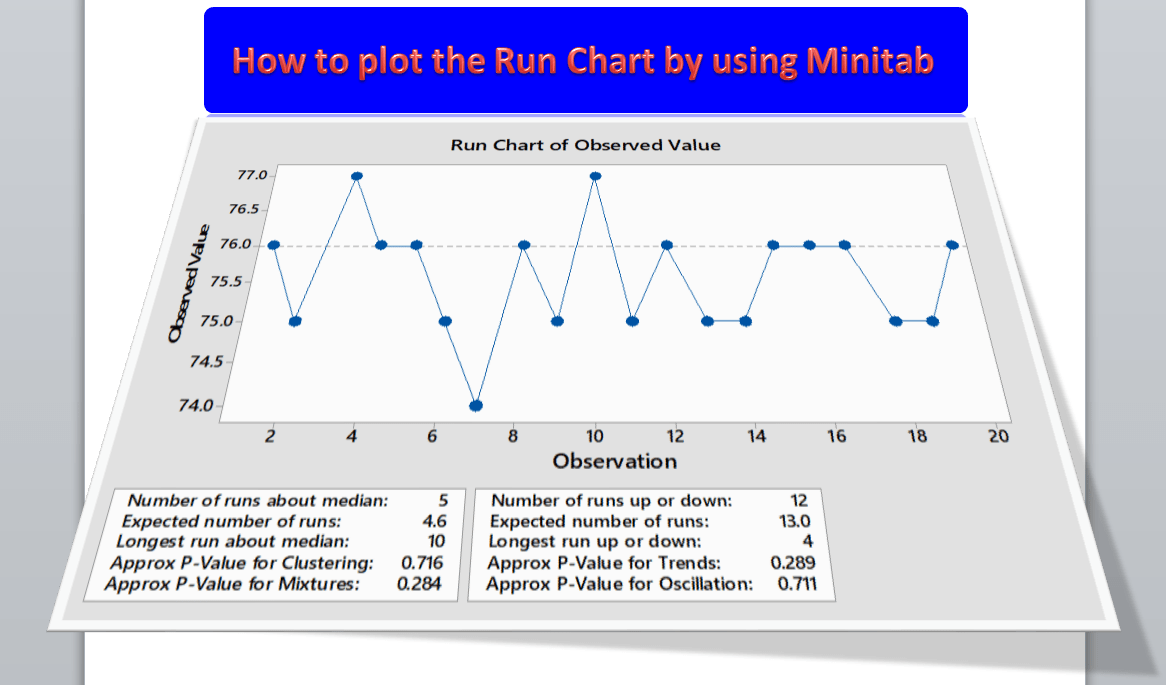
After following up the steps from Step-1 to step-3, The Run Chart will be ready to appear.
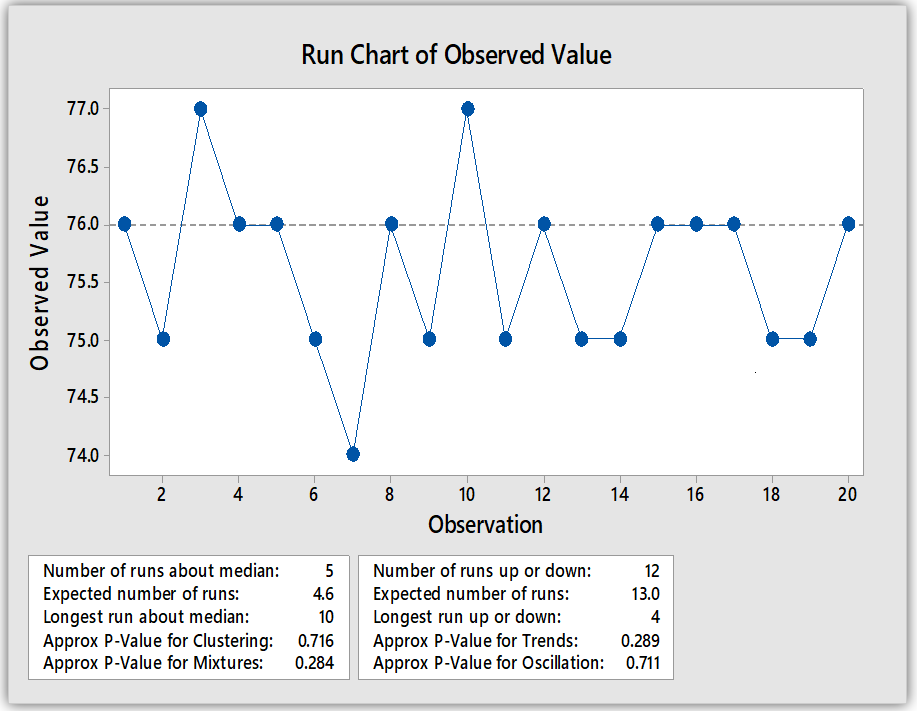
Interpretation of Result: A run chart will give you the approx. P-value of Clustering, Mixtures, Trends, and Oscillation. The Non-Random Variation is not available in the above Run Chart.
Related Post:
Useful Links:


Thank you for reading….Keep visiting Techiequality.Com
Popular Post:

Shanti Gopal Pradhan is an experienced professional in Quality Management Systems, QA, Operations, Business Excellence, and Process Improvement. He has strong expertise in international standards including IATF 16949, ISO 9001, ISO 14001, ISO 45001, and ISO 17025, along with methodologies such as TQM, TPM, and Six Sigma.
He holds a degree in Mechanical Engineering along with an MBA, combining strong technical acumen with strategic business insight, he is a Certified Internal Auditor, Lead Auditor, and Six Sigma Black Belt, with a proven track record in driving quality transformation and operational excellence.