How to Create a Control Chart by Minitab | Minitab Control Chart :
Hi! Reader, Today we are going to learn on how to Create a Control Chart in Minitab.
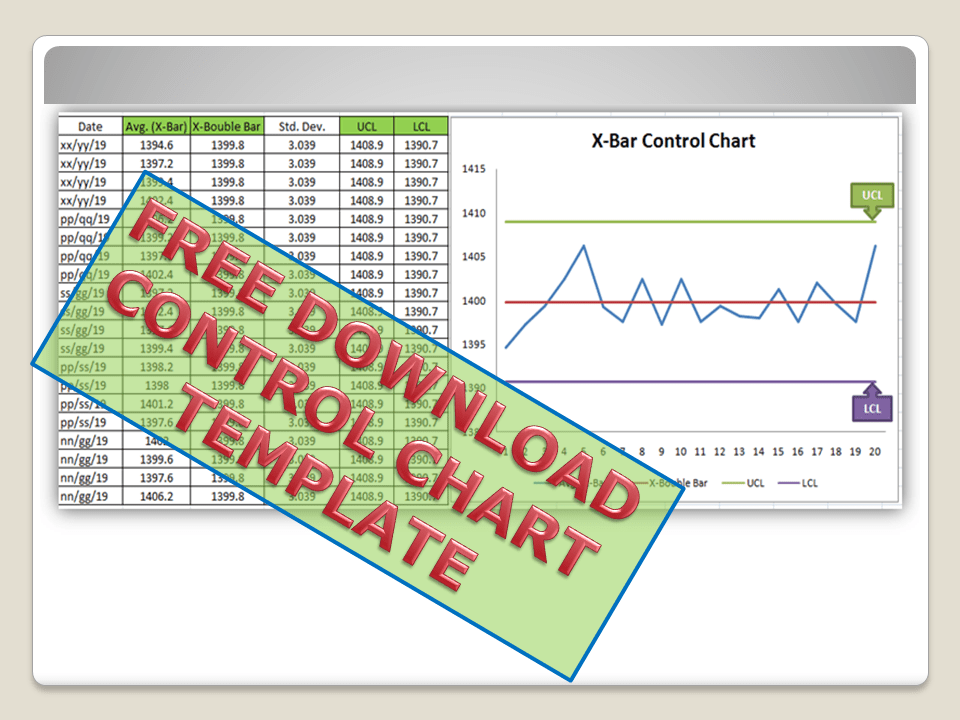
Download the guide in PDF.
A control Chart is a popular tool to identify the process Variations and causes (Common or Special Cause). If you would like to know more about different types of Control Charts then read “What is SPC?”. You will also like to read on “how to plot a control chart in Excel’.
Download the Control Chart Excel Template.
Steps of how to Create Control Chart in Minitab 18:
Step-1:
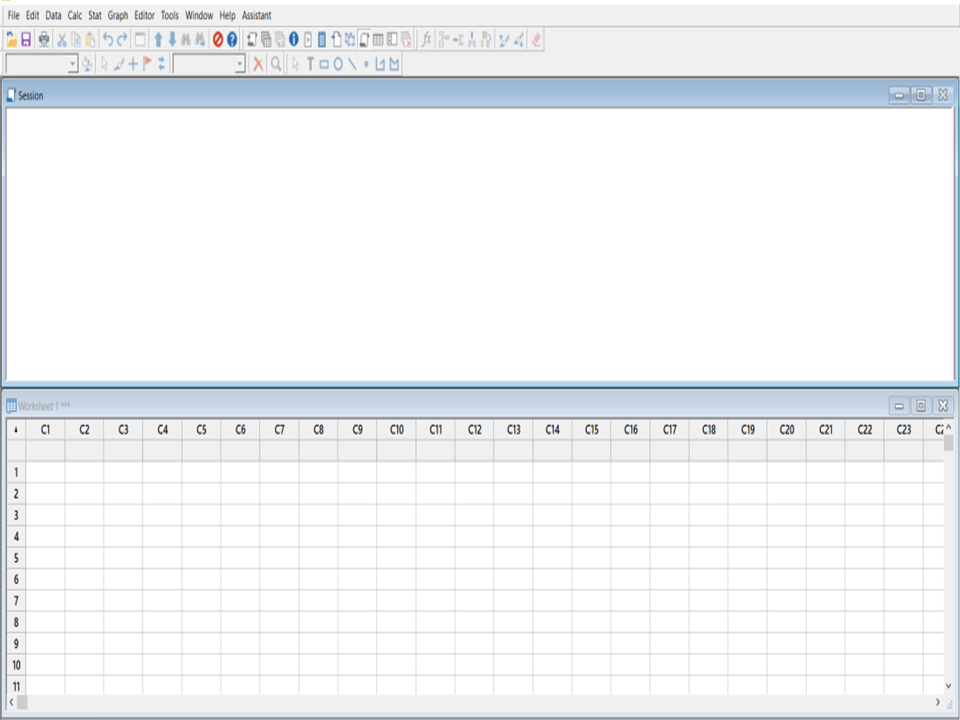
When you will open the Minitab 18, the main screen will appear like below.
Step-2:
Let’s take an example here to understand better. We are having 100 numbers reading of a block’s length as,
Length of Block=120±1mm, Subgroup Size=5, Sample frequency=5 samples per hour.
| Date | Observations/ Reading |
| 12.03.2019 | 119.5 |
| 12.03.2019 | 119.3 |
| 12.03.2019 | 119.4 |
| 12.03.2019 | 119.5 |
| 12.03.2019 | 119.7 |
| 12.03.2019 | 120 |
| 12.03.2019 | 120.1 |
| 12.03.2019 | 120.5 |
| 12.03.2019 | 120.3 |
| 12.03.2019 | 120.4 |
| 12.03.2019 | 120.4 |
| 12.03.2019 | 120.6 |
| 12.03.2019 | 120.3 |
| 12.03.2019 | 119.7 |
| 12.03.2019 | 119.8 |
| 12.03.2019 | 119.2 |
| 12.03.2019 | 119.5 |
…..
….
| 13.03.2019 | 121.1 |
| 13.03.2019 | 120.2 |
| 13.03.2019 | 120.3 |
| 13.03.2019 | 120.4 |
| 13.03.2019 | 120.5 |
| 13.03.2019 | 120.9 |
| 13.03.2019 | 120.8 |
| 13.03.2019 | 120 |
| 13.03.2019 | 120.1 |
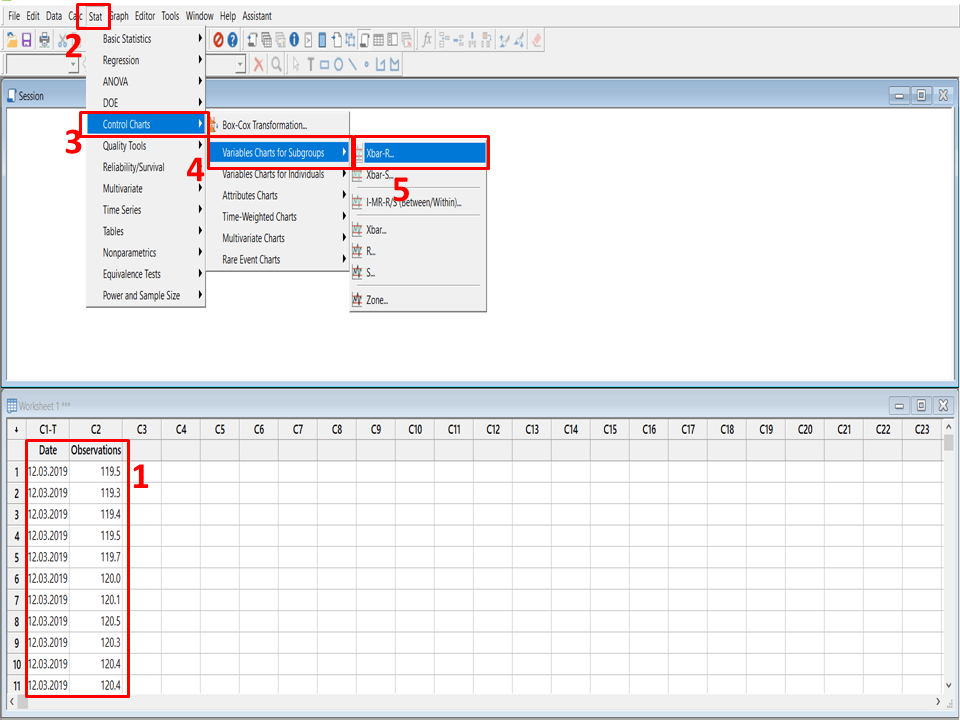
As you can see in the above figure, the same 100-number reading has been entered in box no.1. Now we are supposed to select the Average and range type Chart (because length readings are variable data and we have taken subgroup size is 5). If you would like to know the selection process of different types of Control Charts then read the article “What is SPC?”. Just follow the step-2 to step-5 in the above figure to select the “Average & Range” type control chart.
Step-3:
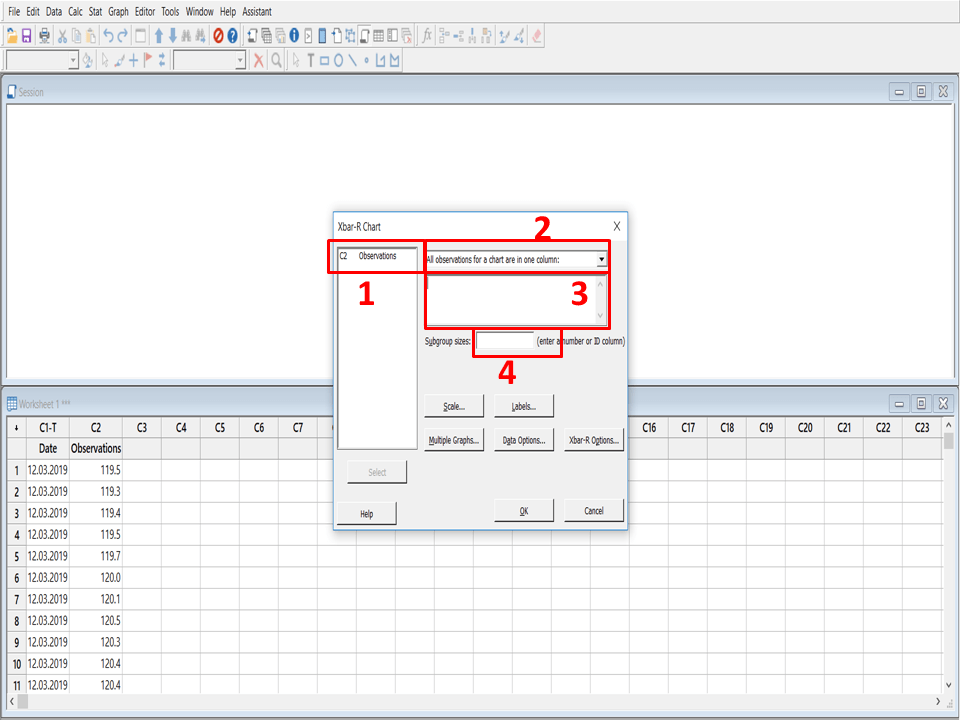
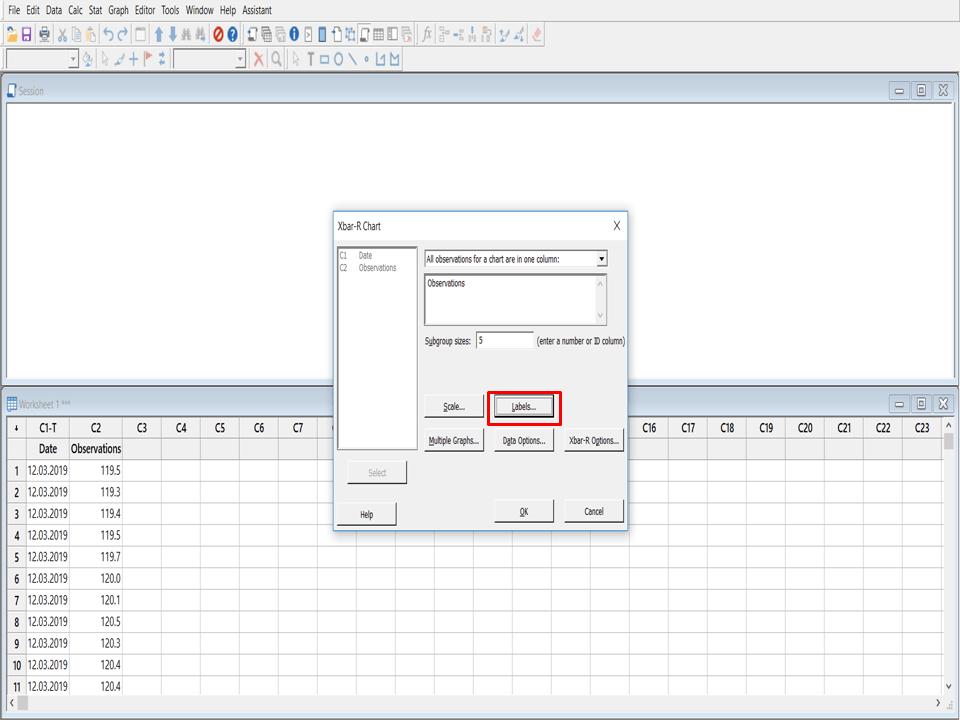
After selecting the “X-bar & Range chart”, such a dialog box will appear on the screen. Now just give more focus on below dialog box, because I will be describing it one by one here. In the box no-1, you can able to see the data point’s column. Now you have to select the data point in box no-3, and then enter “5” in box-4. Next, we have to enter labels to write the Title name.
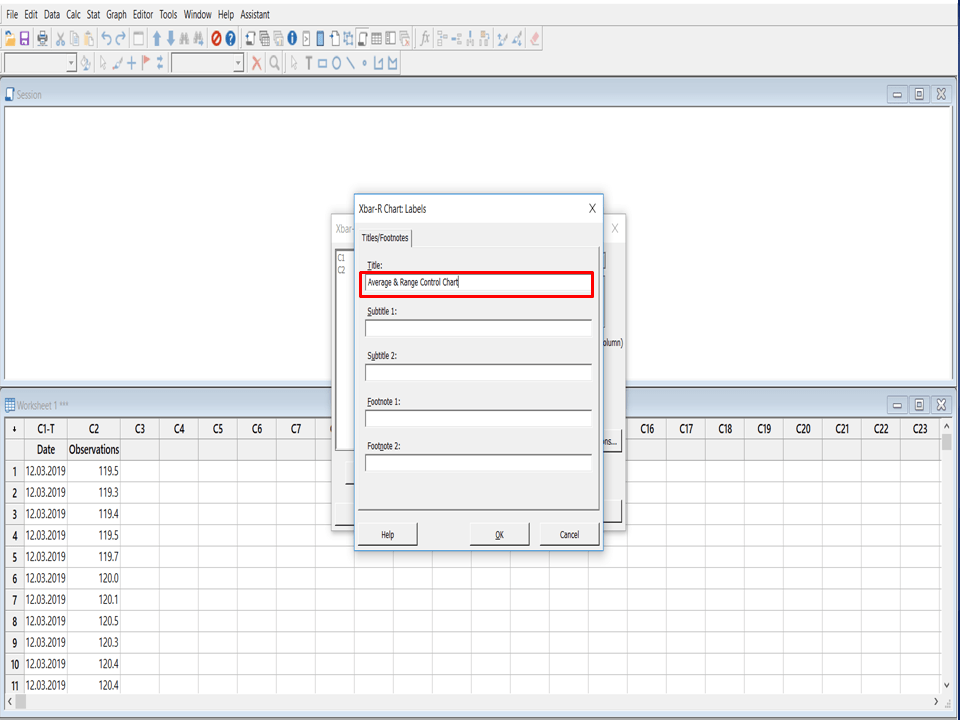
Step-4:
Title name
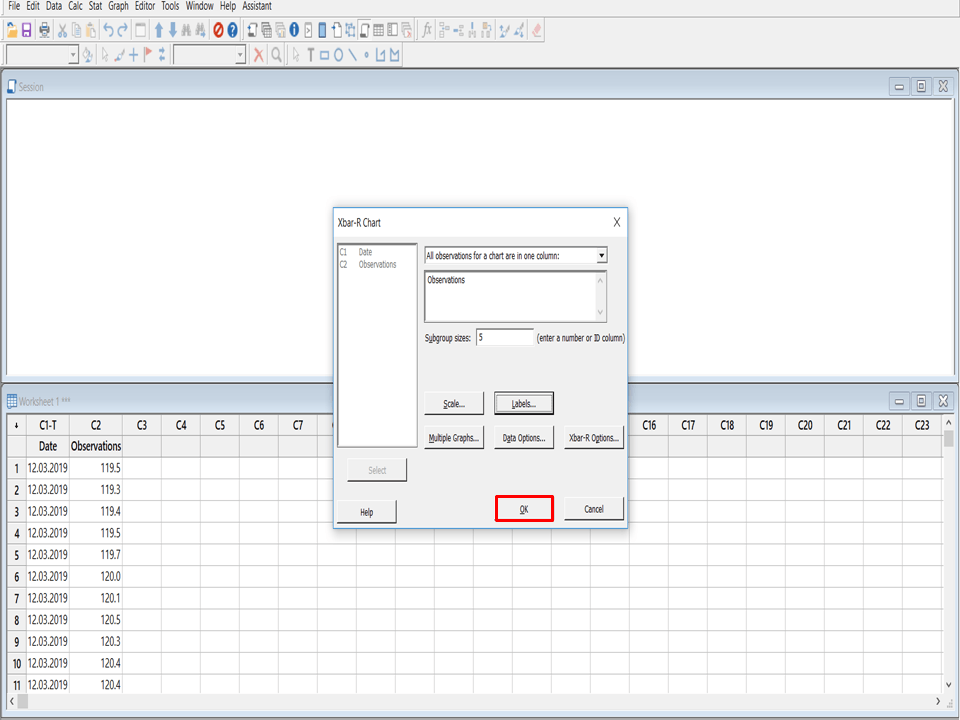
Step-5
After selecting the data point’s column, subgroup size value, and Label, now you have to enter in “ok”. After doing so Control Chart will appear on the screen.
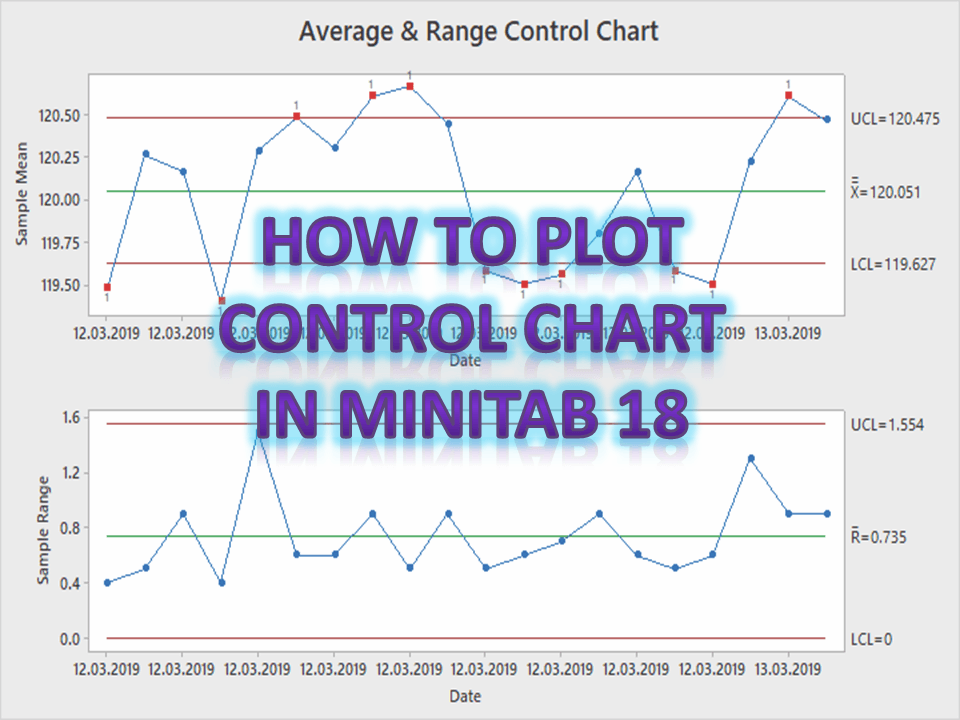
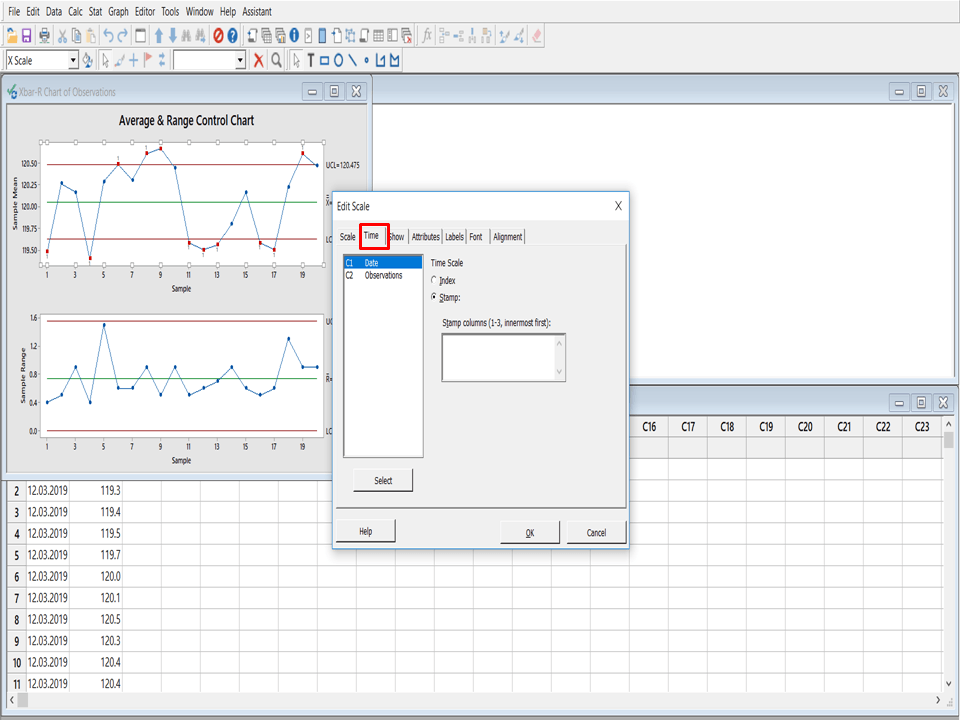
Minitab Control Chart:

FAQ:
Q1: How to change the “X” axis value?
A1: Double click on the “X” axis then you can able to see a
Download Templates:


Thank you for reading ….Keep visiting Techiequality.Com
Popular Post:

Shanti Gopal Pradhan is an experienced professional in Quality Management Systems, QA, Operations, Business Excellence, and Process Improvement. He has strong expertise in international standards including IATF 16949, ISO 9001, ISO 14001, ISO 45001, and ISO 17025, along with methodologies such as TQM, TPM, and Six Sigma.
He holds a degree in Mechanical Engineering along with an MBA, combining strong technical acumen with strategic business insight, he is a Certified Internal Auditor, Lead Auditor, and Six Sigma Black Belt, with a proven track record in driving quality transformation and operational excellence.