What is the difference between Repeatability & Reproducibility?
Hello…Readers! Today here we will discuss the frequently used terms in an industry i.e. Repeatability vs Reproducibility. These two wards are more familiar with Measurement system analysis. So don’t waste your time and go through the below article and enhance your knowledge. If you are further looking for a similar type of article, then click on below links/ topic.
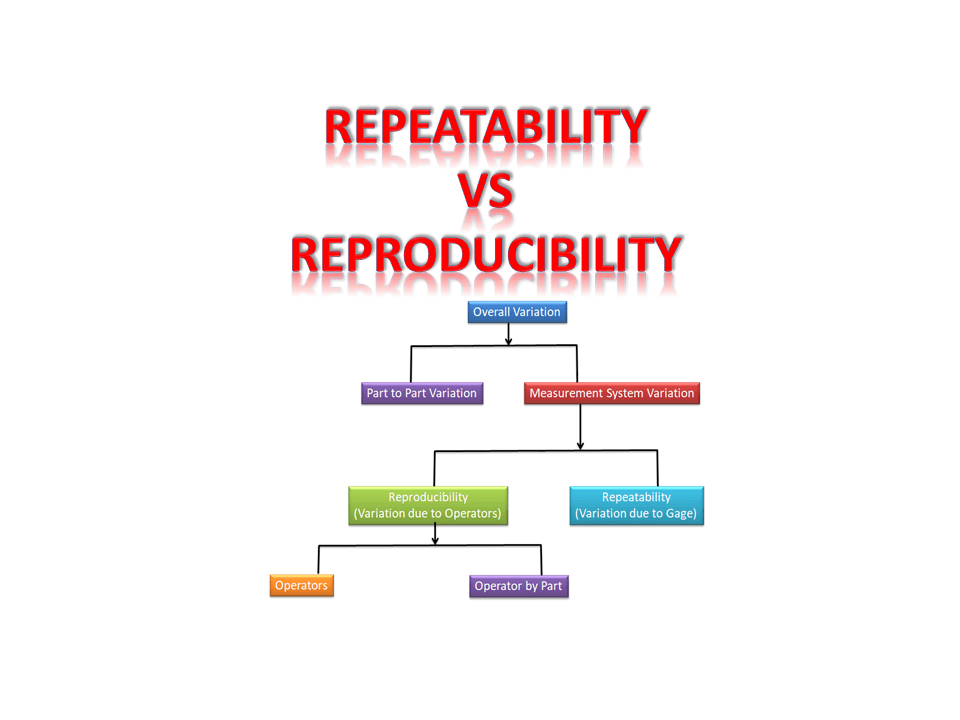
Reproducibility vs Repeatability :
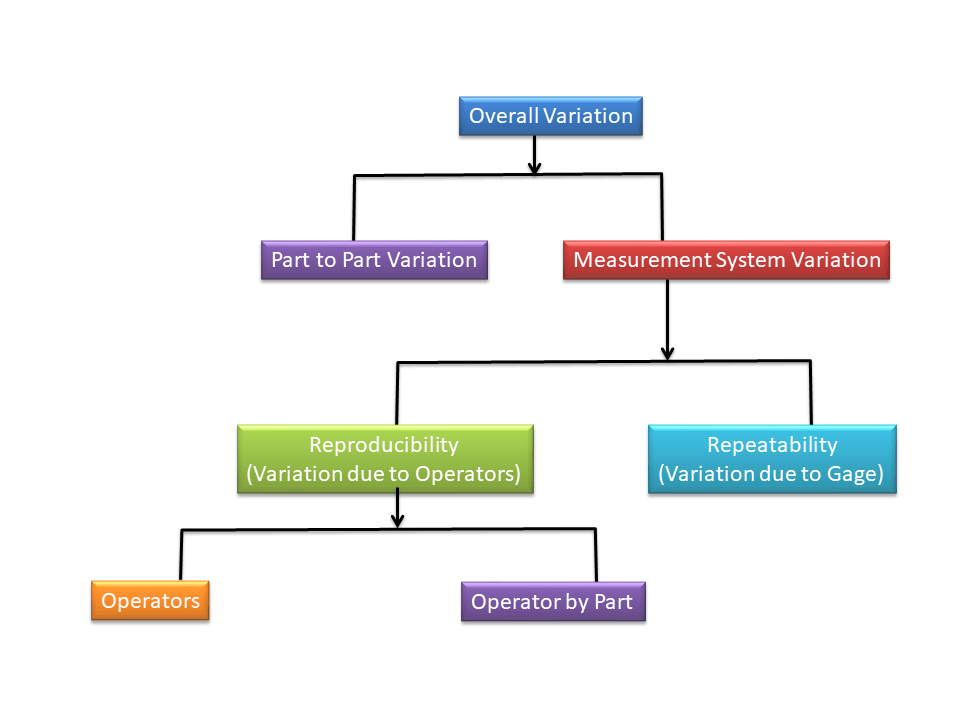
Repeatability: Variation due to Gage.
As per the MSA Manual, The common cause, random variation resulting from successive trials under defined conditions of measurement. Often denoted to as equipment variation (EV), although this is misleading. The best term for repeatability is within-system variation when the conditions of measurement are fixed and defined the fixed part, instrument, standard, method, operator, environment, and assumptions. In addition to within equipment variation, repeatability will include all within variations from the conditions in the measurement error model.
It’s an Equipment variation.
Reproducibility: Variation due to Operators.
As per the MSA Manual, The variation in the average of measurements is caused by a normal condition(s) of change in the measurement process. Naturally, it has been defined as the variation in average measurements of the same part between different operators using the same measuring instrument & method in a stable environment. This is frequently true for manual instruments influenced by the skill of the operator. It is not true, however, for measurement processes (automated systems) where the operator is not a major source of variation. For this reason, reproducibility is mentioned as the average variation between systems or between conditions of measurement.
It’s a variation due to the operators, measuring the same part using the same measuring instrument and method in a stable environment.
Useful Articles:
The Key difference between Corrective Action and Preventive Action.
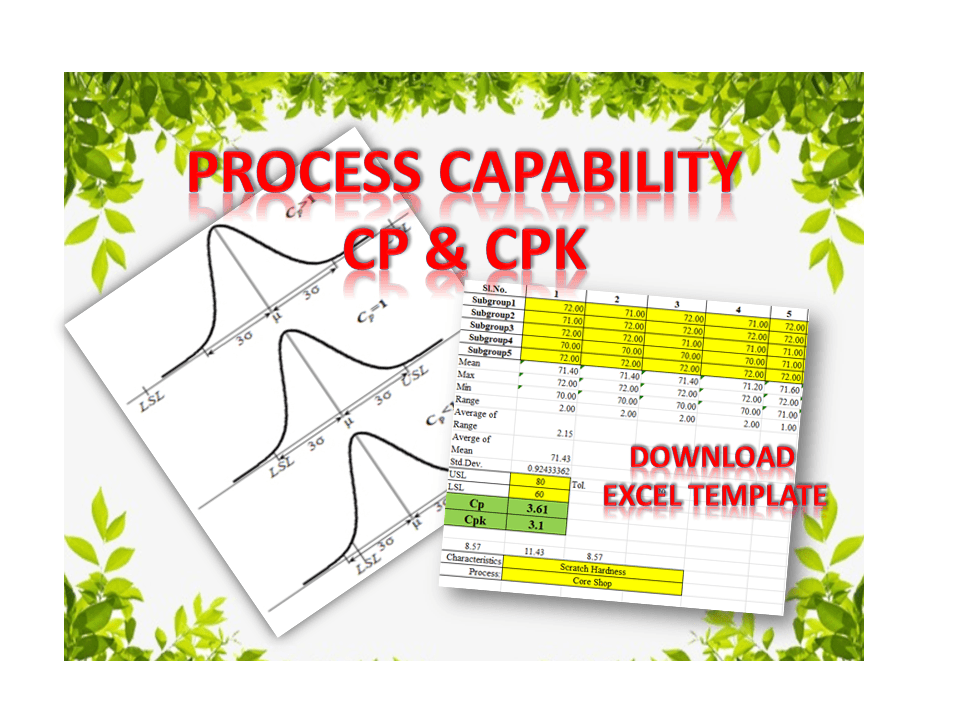
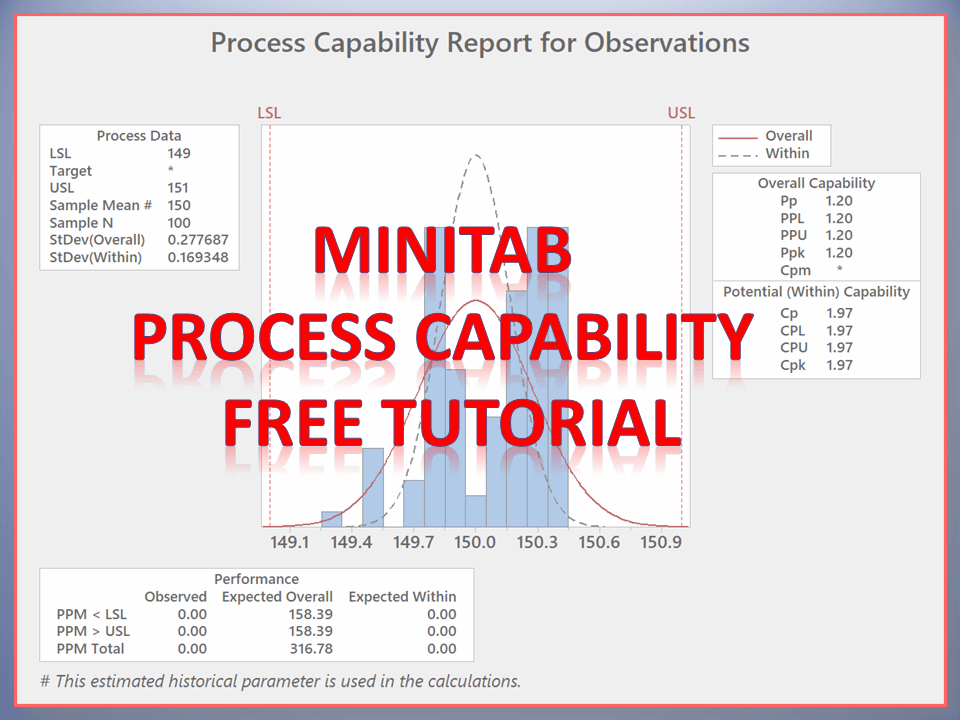
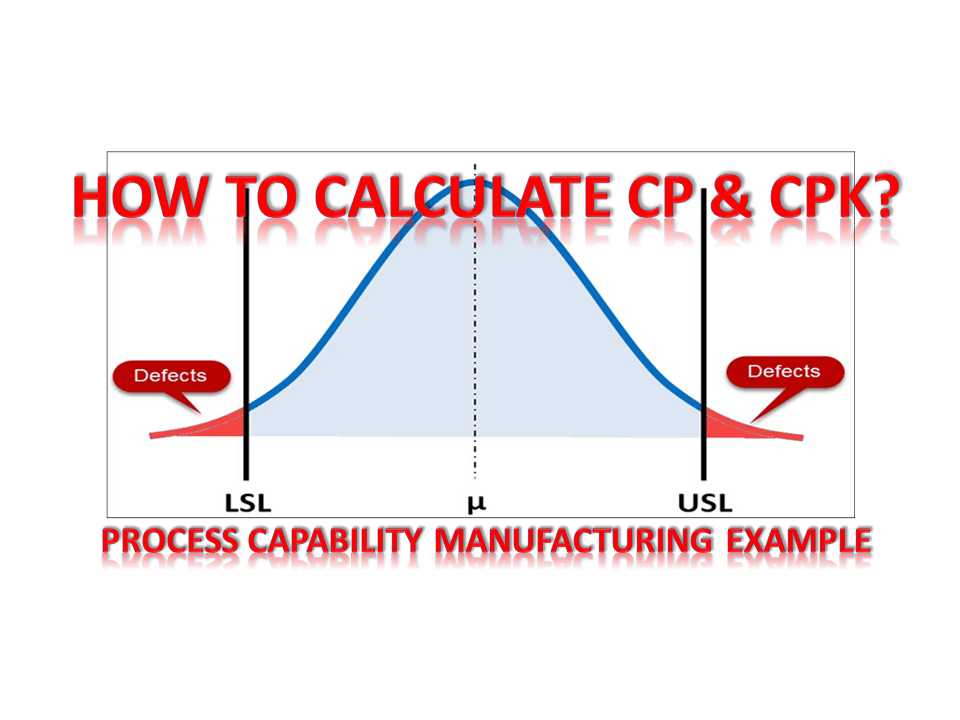
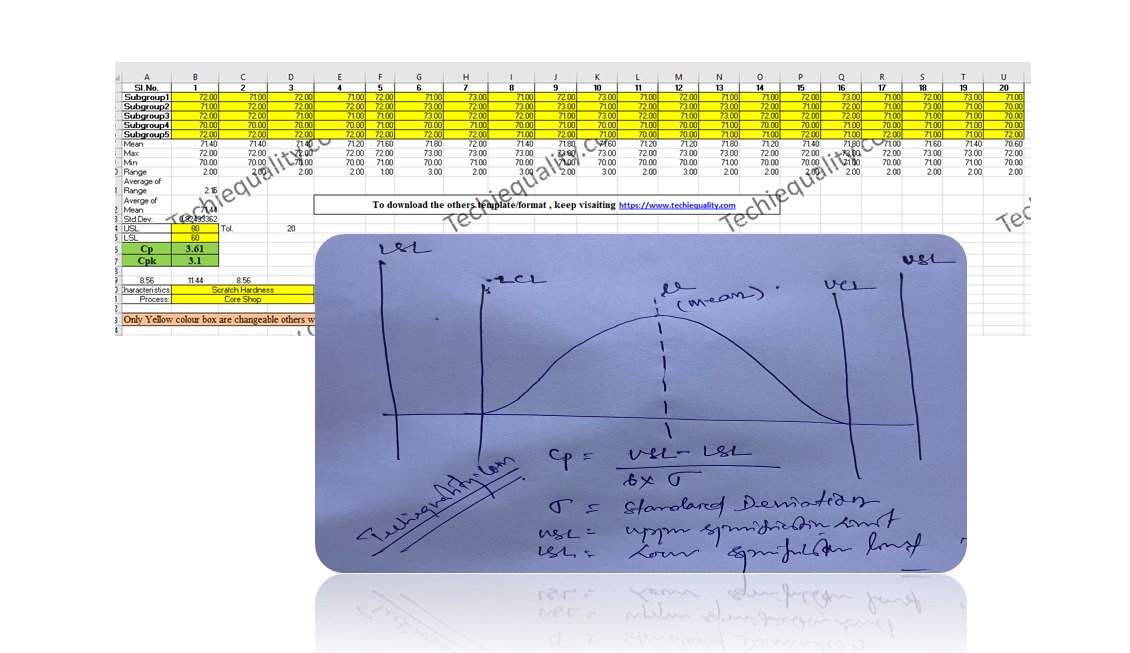
Process Capability Analysis |Cp & Cpk Calculation Excel Sheet with Example.
How to calculate Cp and Cpk? |Practical Case Study | Process Capability Example


Thank you for reading…..Keep visiting Techiequality.com
If you require any further information, feel free to contact us.
Popular Post:

Shanti Gopal Pradhan is an experienced professional in Quality Management Systems, QA, Operations, Business Excellence, and Process Improvement. He has strong expertise in international standards including IATF 16949, ISO 9001, ISO 14001, ISO 45001, and ISO 17025, along with methodologies such as TQM, TPM, and Six Sigma.
He holds a degree in Mechanical Engineering along with an MBA, combining strong technical acumen with strategic business insight, he is a Certified Internal Auditor, Lead Auditor, and Six Sigma Black Belt, with a proven track record in driving quality transformation and operational excellence.