How to calculate Cp and Cpk? | Process Capability Example
Hi readers! today we are going to discuss on Process Capability Example. The Process Capability (Cp) and Process Capability Index (Cpk) are very important tools to measure the process Capability of a Stable Process.
DOWNLOAD (Cp & Cpk Excel Template).
Process Capability Example is given below to understand better.
Process Capability (Cp):
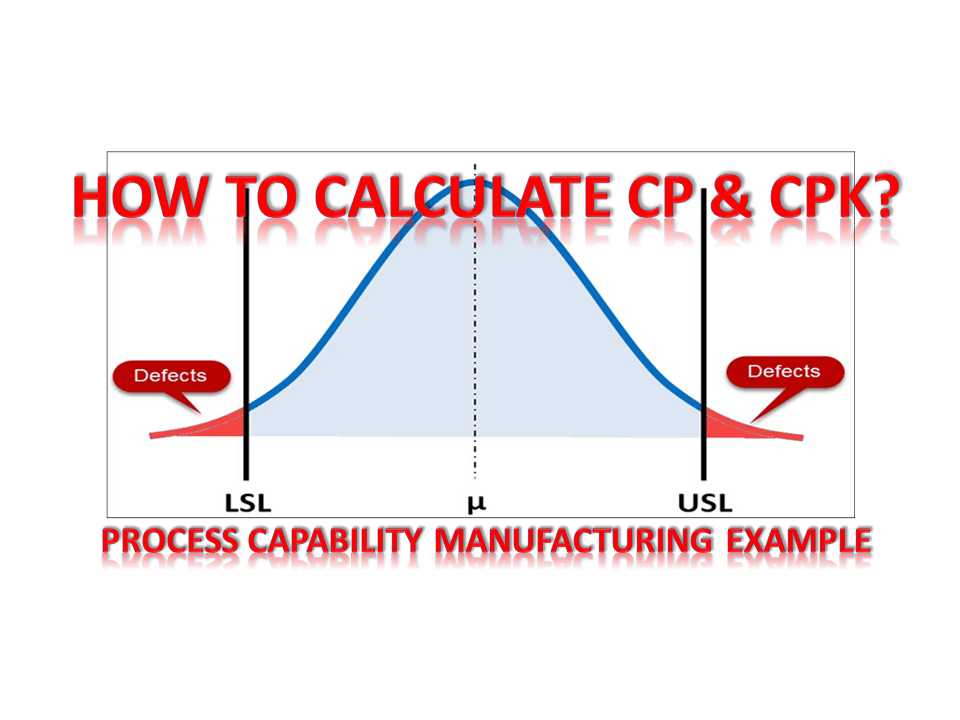
- Process Capability (Cp) is a statistical measurement of a process’s ability to produce parts within specified limits on a consistent basis
- It gives us an idea of the width of the Bell curve.
- The Process Capability for a stable process is typically defined as ((USL-LSL)/ (6 x Standard Deviation)).
Process Capability Index (Cpk):
- It shows how closely a process is able to produce the output to its overall specifications.
- More Value of Cpk means more process capable.
- Cpk value <1 means the bell curve will be out of USL/LSL
- Common Cpk vale=1,1.33,1.67 & 2
- The Cpk value of a startup manufacturing organization is supposed to be 1.33.
- The Process Capability Index for a stable process is typically defined as the minimum of CPU or CPL
Process Capability Example (Manufacturing Example):
The XYZ Pvt. Ltd, the organization manufactures oil sump. In their quality assurance plan, they have mentioned the Pouring Temperature (Process Parameter of the Melting Process) is a critical characteristic. So they have decided to monitor the Cp and Cpk trend.
The Specification of Pouring Temperature is 1400±10°C.
The Process Engineer has observed the Pouring Temperature and listed the same as below table;
Table (Readings):
| Sl. No | SB1 | SB2 | SB3 | SB4 | SB5 | RANGE |
| 1 | 1403.0 | 1402.0 | 1402.0 | 1401.0 | 1401.0 | 2 |
| 2 | 1401.0 | 1401.0 | 1401.0 | 1400.0 | 1400.0 | 1 |
| 3 | 1402.0 | 1402.0 | 1402.0 | 1401.0 | 1401.0 | 1 |
| 4 | 1400.0 | 1400.0 | 1400.00 | 1399.00 | 1399.00 | 1 |
| 5 | 1402.0 | 1402.0 | 1401.0 | 1401.0 | 1400.0 | 2 |
| 6 | 1403.0 | 1403.0 | 1402.0 | 1402.0 | 1401.0 | 2 |
| 7 | 1400.0 | 1400.0 | 1399.0 | 1399.0 | 1398.0 | 2 |
| 8 | 1402.0 | 1402.0 | 1402.0 | 1401.0 | 1401.0 | 1 |
| 9 | 1401.0 | 1401.0 | 1400.0 | 1400.0 | 1399.0 | 2 |
| 10 | 1399.0 | 1399.0 | 1399.0 | 1398.0 | 1398.0 | 1 |
| 11 | 1400.0 | 1400.0 | 1400.0 | 1400.0 | 1399.0 | 1 |
| 12 | 1402.00 | 1402.00 | 1402.00 | 1401.0 | 1401.0 | 1 |
| 13 | 1402.0 | 1402.0 | 1402.0 | 1401.0 | 1401.0 | 1 |
| 14 | 1400.0 | 1400.0 | 1399.0 | 1399.0 | 1398.0 | 2 |
| 15 | 1400.0 | 1400.0 | 1400.0 | 1400.0 | 1399.0 | 1 |
| 16 | 1399.0 | 1399.0 | 1398.0 | 1398.0 | 1397.0 | 2 |
| 17 | 1401.0 | 1401.0 | 1401.0 | 1400.0 | 1400.0 | 1 |
| 18 | 1402.0 | 1402.0 | 1401.0 | 1401.0 | 1400.0 | 2 |
| 19 | 1400.0 | 1400.0 | 1400.0 | 1399.0 | 1399.0 | 1 |
| 20 | 1401.0 | 1401.0 | 1400.0 | 1400.0 | 1399.0 | 2 |
Range=Maximum Value-Minimum Value
Average of Range=1.45
Value of d2=2.326 (For Subgroup size 5)
USL = 1410°C, LSL = 1390°C.
Standard Deviation:
= Average of Range/d2
1.45/2.326
=0.623
Process Capability (Cp Formula):
= ((USL-LSL)/ (6 x Standard Deviation))
= (1410-1390)/ (6 x 0.623)
20/3.738
= 5.351
Process Capability Index (Cpk Formula):
CPU:
= ((USL-Average of Mean)/3 x Standard Deviation)
= (1410-1400.42)/ (3 x 0.623)
9.58/ 1.869
= 5.12
CPL:
= ((Average of Mean-LSL)/3 x Standard Deviation)
= (1400.42-1390)/ 1.869
10.42
=5.58
Cpk= 5.12 (minimum of CPU or CPL).
More on TECHIEQUALITY


Thank you for reading….Keep visiting Techiequality.Com
Popular Post

Shanti Gopal Pradhan is an experienced professional in Quality Management Systems, QA, Operations, Business Excellence, and Process Improvement. He has strong expertise in international standards including IATF 16949, ISO 9001, ISO 14001, ISO 45001, and ISO 17025, along with methodologies such as TQM, TPM, and Six Sigma.
He holds a degree in Mechanical Engineering along with an MBA, combining strong technical acumen with strategic business insight, he is a Certified Internal Auditor, Lead Auditor, and Six Sigma Black Belt, with a proven track record in driving quality transformation and operational excellence.