What is Visual Management?| Visual Management Board Examples
Hi Readers! Here, today we are going to discuss on what is visual management. Its examples and tools. The Visual management is a method to visualize the performance, standards, and signs in operation or any activities. This visual standard is widely used in a manufacturing operation to enhance operation excellence, performance and optimize the output from the operation or activities. The main purpose of the visual management is to communicate the important criteria to the shop floor workforce in visual forms.
Benefits of Visual Management
- Cost reduction
- Easy understanding of performance
- Quick reference of critical parameters and one-step process.
- Waste reduction
- Reduced dependency for understanding the critical operation standard
- Status of objectives
- Information sharing
- Improve productivity, rate of quality, cost, delivery, morale, and product & operator safety.
- Promote values
- Raise awareness
- Improve accountability, etc.
What are the common tools used in industries to implement visual management? As we all know that we can easily understand and remember the visual sign rather than information in other forms. So it’s an effective method to control your operation process and optimize the output. The common tools and methods used in industries are given below;
- FIFO (First in First Out): This is a very helpful tool that you can control your material flows in systematic ways. In this process, you can easily manage your material storage and movement.
- 5’S: the 5’S stand for Sort, set in Order, Shine, Standardize, and Sustain.
- Display: Display board, Sign, labels, and marking.
- OPL, OK and Not OK process sample display, colour code, level, Visual poka yoke, do & don’t, and Andon system.
- Digital display
Example of visual management
FIFO:
Visual management is one of the best techniques in an organization by which very easily and quickly, you can understand critical information in visual ways. I think visual information is very easy to understand and helps to enhance the optimize the output and minimize the waste/ errors. FIFO is the one of the visual management systems which means First-In-First-Out. For inventory management, FIFO is the one of the best techniques to help for systematic storage and handling of materials/products/elements, etc. Some common FIFO systems are –colour code systems, numbering, bin cards, digital FIFO systems, IOT-based FIFO, etc.
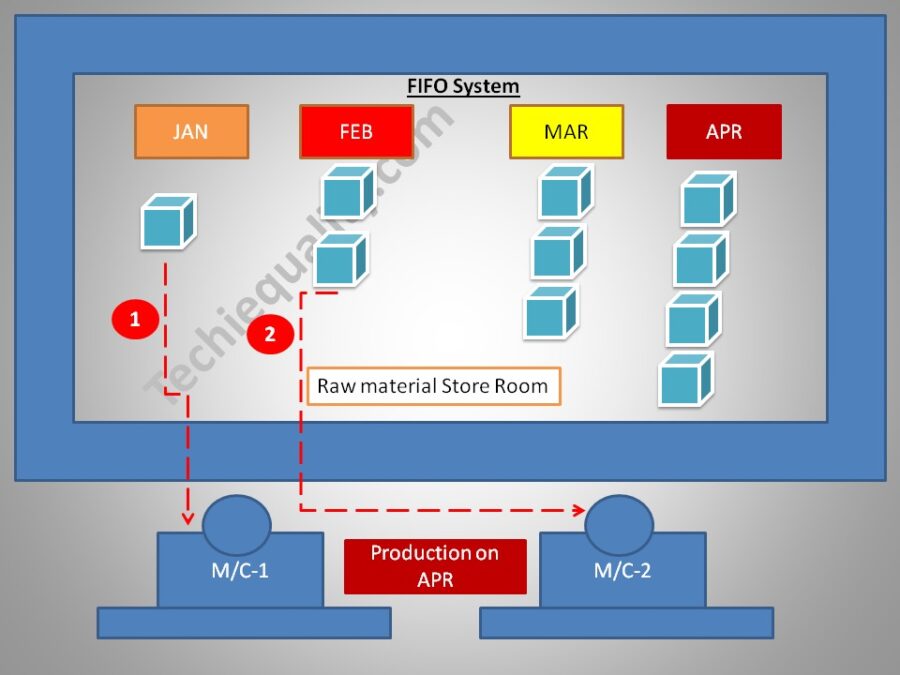
Example: suppose an organization is being planned to implement the FIFO visual management system at raw material store room. So the store manager decided to store the material in month-wise material received in the different racks with month-wise colour codes. So that the first incoming raw material can be used first in the production area. Accordingly, to the colour code, the store manager issued the material to the user department. In the below image, you can easily understand that how the material is stored with month-wise colour code. As you can see in the below image, production is for the month of April, and the store manager issuing the material available in the month of January instead of month April. This is the material issuing and handling followed by the FIFO system.
5’S:
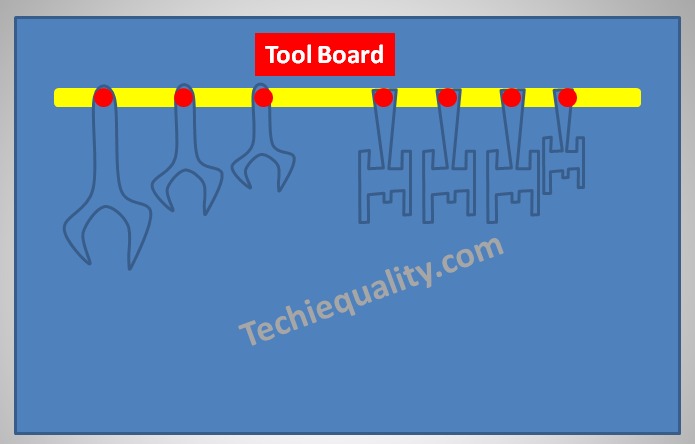
The 5’S is the base pillar of visual management or visual control. The terms 5’S are the [1] Sort, [2] Set in order [3] Shine, [4] Standardize and [5] Sustain. From the office to the manufacturing shop floor, you can easily implement the 5’S concept. We have taken an example as a tool board for a better understanding of the 5’S concept for easy implementation in the manufacturing industry. As you can see in the tool board image below that how the different sizes and types of tools are placed in a systematic manner followed by the5’S concept.
Match Marking:
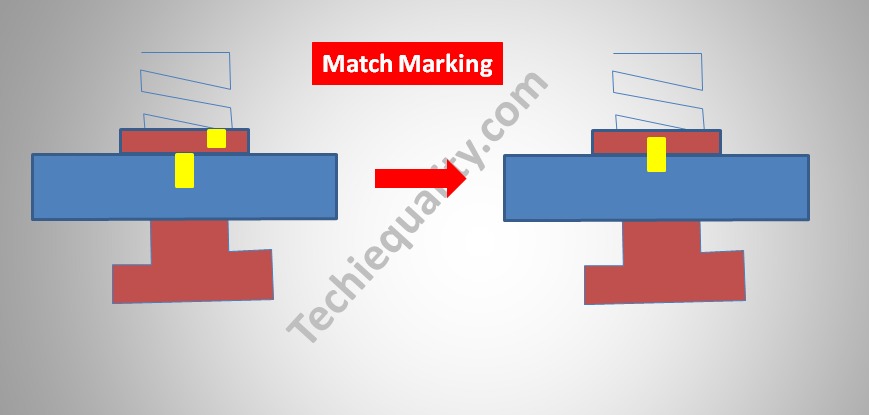
Match marking refers to the process in which a pictorial view is provided to place the pieces in the position of the marked point by identifying the final output image. E.g. In the image attached below an object is placed between the nut and the bolt. Now by looking at the final image, we can understand that the nut has to be rotated in such a way that the object placed in between the nut and bolt gets tightened or fixed. To do this one will need to rotate the nut to an extent that it matches with the yellow mark as shown in the output image.
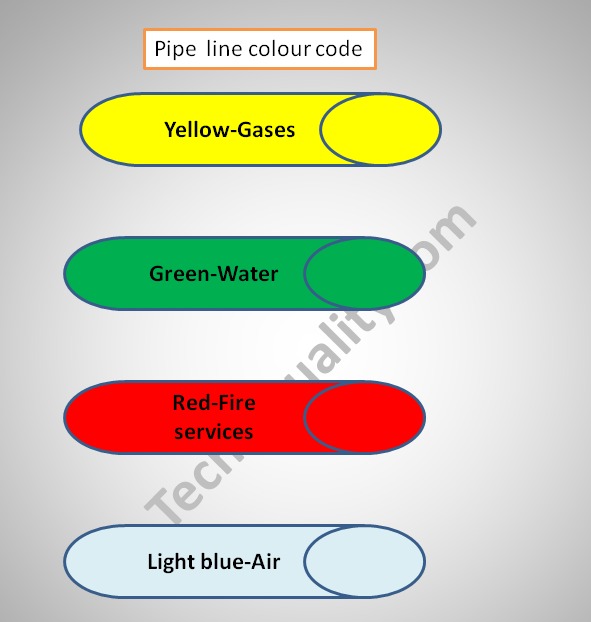
Pipeline colour code on shop floor:
Pipeline colour coding is done to help one identify the contents flowing through the pipe. Also, additional details would be required to be provided if any hazardous material is flowing through the pipe to avoid any mishap. Thus pipeline colour coding helps in obtaining crucial information about the pipes contents. E.g. Now in the image provided below we can see the Pipeline visual display has been provided in four colours:-
The yellow coloured pipeline represents gas.
The green coloured pipeline represents water.
The red coloured pipeline represents components required for fire services.
The Light blue coloured pipeline represents air element present.
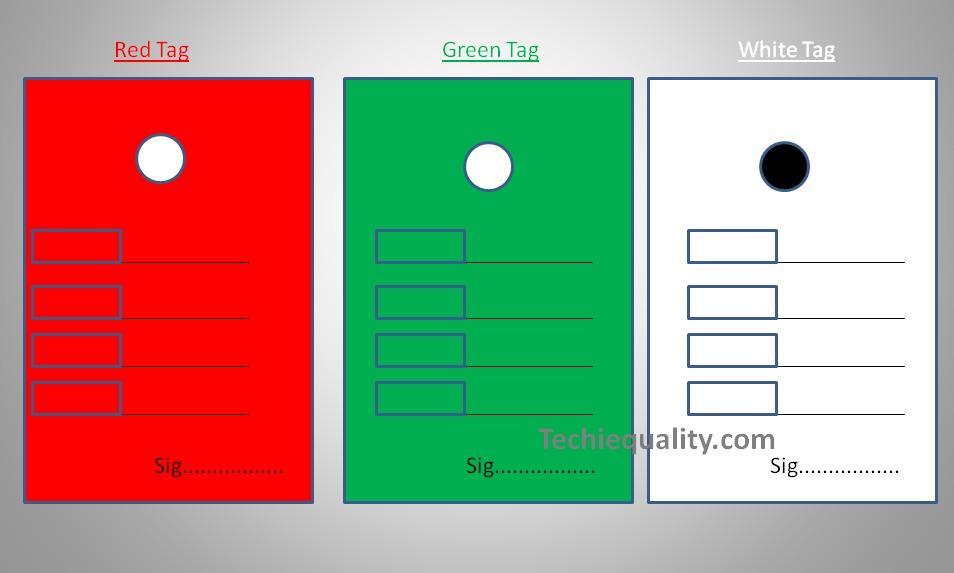
Tag System:
The Tag system helps in the easy identification of the segment of a product with the help of just the tag. Now let’s understand how? When any kind of production takes place in a factory it’s quite understood that on production you do get some wastage or rejections. Suppose a factory does the production of garments. Now in the process of production, there are certain items that get rejected for several reasons. Again there are several garments that need to be recertified before being sent out to the market.
Through the below presented image, we can easily understand that the garments which are tagged in Red are the rejected ones and cannot be sent out to the market. Green Tags represent the ones that are perfect to be sent out to the buyers. White tags are the ones that have been kept on hold for further verification due to the possibility of thread cutting or needs stitching before it’s sent out to the market.
Visual Management Board:
Shop floor display helps in streamline the process of work. The visual display helps in improving the workplace functioning by ensuring that the important information is clearly presented in a professional manner. Shop floor display works as a fundamental to any well communicated working environment. It helps in managing the operations of the manufacturing unit for effective planning and productivity. In the image provided below following information is provided for better understanding:-
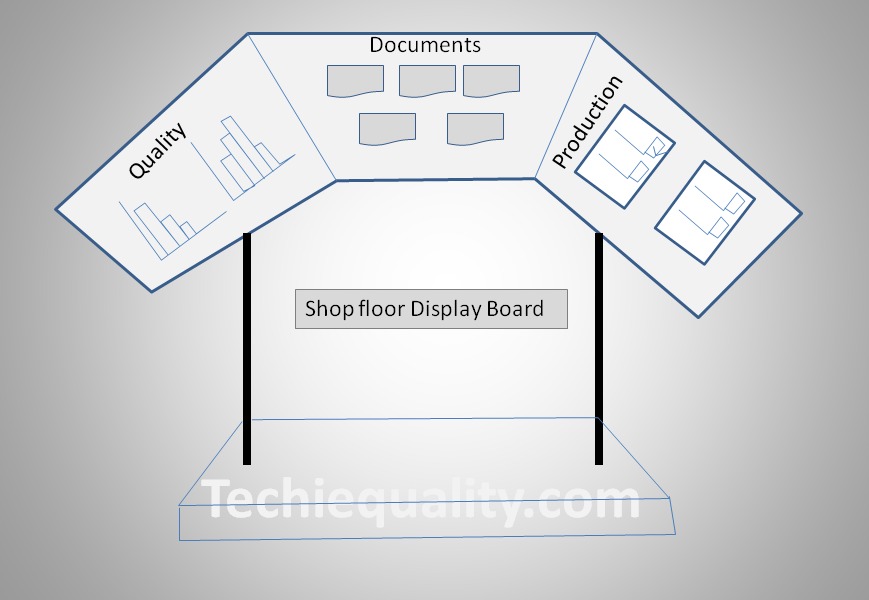
Quality is presented with the help of a graph which helps one in identifying and comparing whether the quality is improving or deteriorating by merely looking at the graph. Similarly, different charts are displayed related to production performance to know the status, and understand the present position. In the shop-floor visual management board, you can display the critical information related documents, OPL, master sample, instruction, etc.
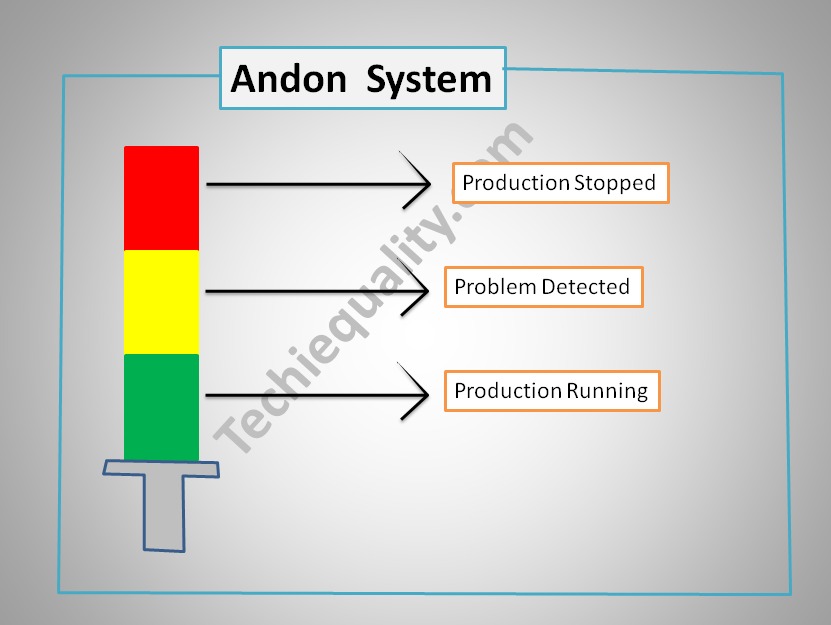
Andon System:
The Andon system is one of the strong visual management tools or visual control systems which promptly alerts about the status or problem of the operation line. In the below image, we have considered three colours Andon alert system as an example. Where different colours indicate different meanings. [1] Green colour light –There is no problem in the operation line. [2] yellow colour light- problem detected in line, [3] red colour light- problem exists, production stopped / operation stopped.
Useful Post:
Variation Calculation in Excel | Types of Variation |Manufacturing Example
Equipment Ranking Process | A B C Ranking of Machine with Manufacturing Example
What is Preventive Maintenance? | Predictive Maintenance |Types & Example
Plan Do Check Act Cycle | PDCA Cycle Manufacturing Example | Implementation


Thank you for reading…Keep visiting Techiequality.Com
Popular Post

Shanti Gopal Pradhan is an experienced professional in Quality Management Systems, QA, Operations, Business Excellence, and Process Improvement. He has strong expertise in international standards including IATF 16949, ISO 9001, ISO 14001, ISO 45001, and ISO 17025, along with methodologies such as TQM, TPM, and Six Sigma.
He holds a degree in Mechanical Engineering along with an MBA, combining strong technical acumen with strategic business insight, he is a Certified Internal Auditor, Lead Auditor, and Six Sigma Black Belt, with a proven track record in driving quality transformation and operational excellence.