How to Plot Pareto Chart in Excel | Manufacturing example
How to Plot Pareto Chart in Excel ( with example), step-by-step guide and illustration with example is given below, just follow to prepare the Pareto chart in Excel.
DOWNLOAD-Pareto Chart Excel Template/Format.
History and Definition:
A Pareto Chart is named after the Italian Economist Vilfredo Pareto. It is a type of chart which contains both bars and a line graph, where the individual values are represented in the bar graph in descending order (largest to smallest value) and the cumulative percentage is represented in the line graph.
Purpose of Pareto Chart:
The purpose of the Pareto Chart is to indicate the Contributions among the set of data.
E.g. let us have six types of defects that we would like to know the most cumulative contributions among them those contributing the 90%, in such a scenario, we have to plot the Pareto Chart to know the 90% contribution with the help of line Chart, we simply cover the 90% level of line Chart, those are coming under the line graph will represent the 90% contribution. so simply Pareto Chart is helping here to identify the contribution.
Understanding the Pareto Chart principle (The 80/20 rule):
The Pareto principle is also known as the 80/20 rule derived from the Italian Economist Vilfredo,
The principle is understood as –
20% of the input creates 80% of the results
Or
80 % of the effects come from 20% of the causes.
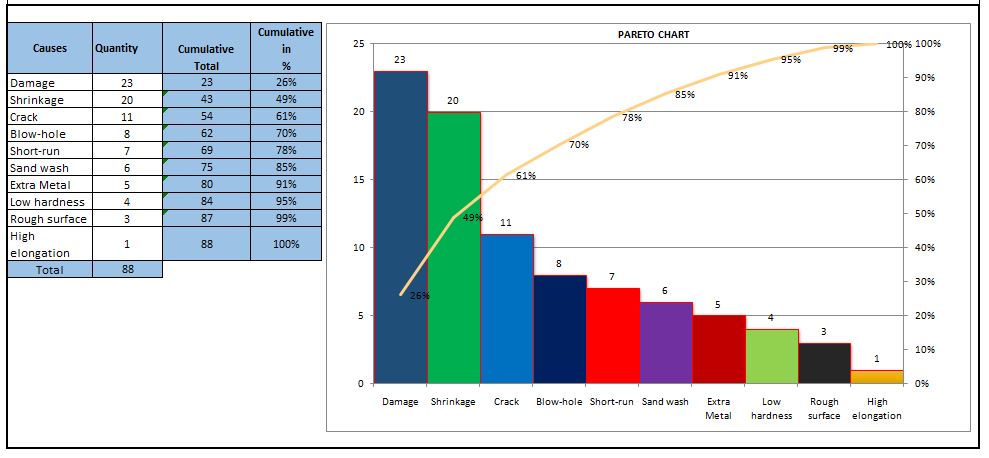
Illustration of How to Plot Pareto Chart in Excel

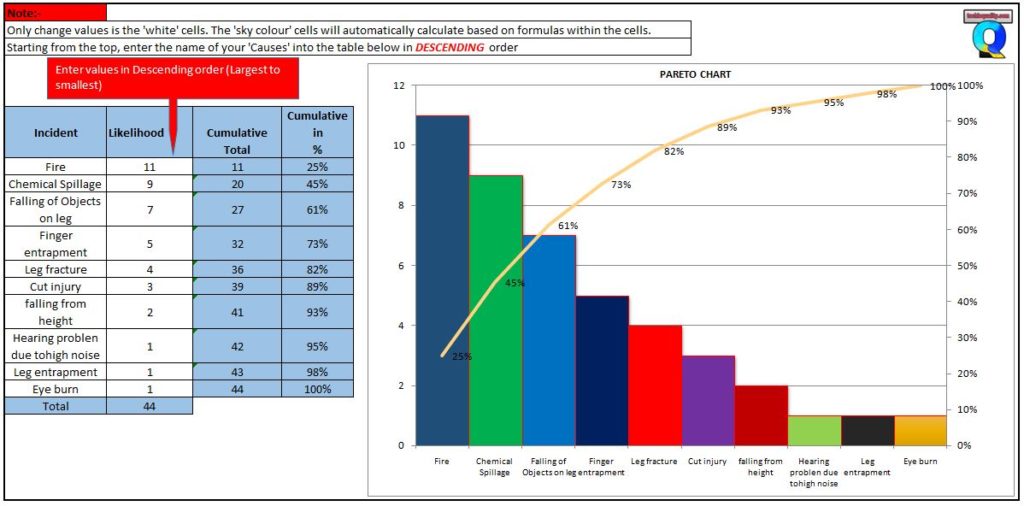
In the above Pareto Chart, we can see the cumulative% in the line graph, According to the Pareto Chart principle 80/20 rule, the 80% cumulative in the line graph is filling under the low hardness, which means BH, Damage, SH and Low hardness defers are coving the 80% of contribution over total types of defects. And those 80 % contributions were due to the 20% of the cause.
Advantages of Pareto Chart:
1. To optimize the production
2. Reduces the Rejections
3. Reduce the COPQ/COQ
4. Improve the quality
5. Improve the performance of the product
6. Improve the customer satisfaction
7. Reduce the rework cost.
Etc.
How to Plot Pareto Chart in Excel ( with example):
Step -1
We have six types of defects BH(Blow Hole), Damage, SH(Shrinkage), Low hardness, Crk( Crack), and pinhole, and the total rejection quantity is 199. So now we have to arrange/sort the rejection Quality value in descending order (largest to smallest)
Then we have to calculate the cumulative rejection quantity and cumulative % as per the below step ( from steps 1 to 3)
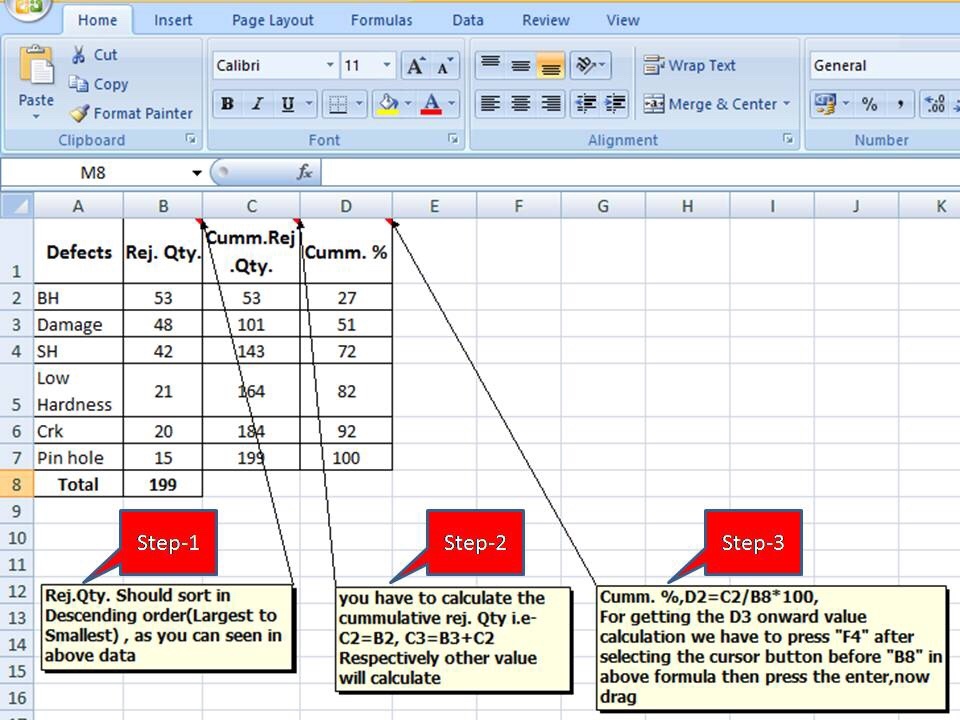
As described above, the Rejection quantity should be sorted in descending order(Largest to smallest), then you have to calculate the cumulative rejection quantity i.e C2=B2, C3=B3+C2, respectively other values need to be calculated, and finally Cumulative %, D2=C2/B8x100, for getting the D3 onward value calculation, we have to press “F4” after selecting the cursor button before “B8” in the above formula then press the enter, now drag.
Step -2
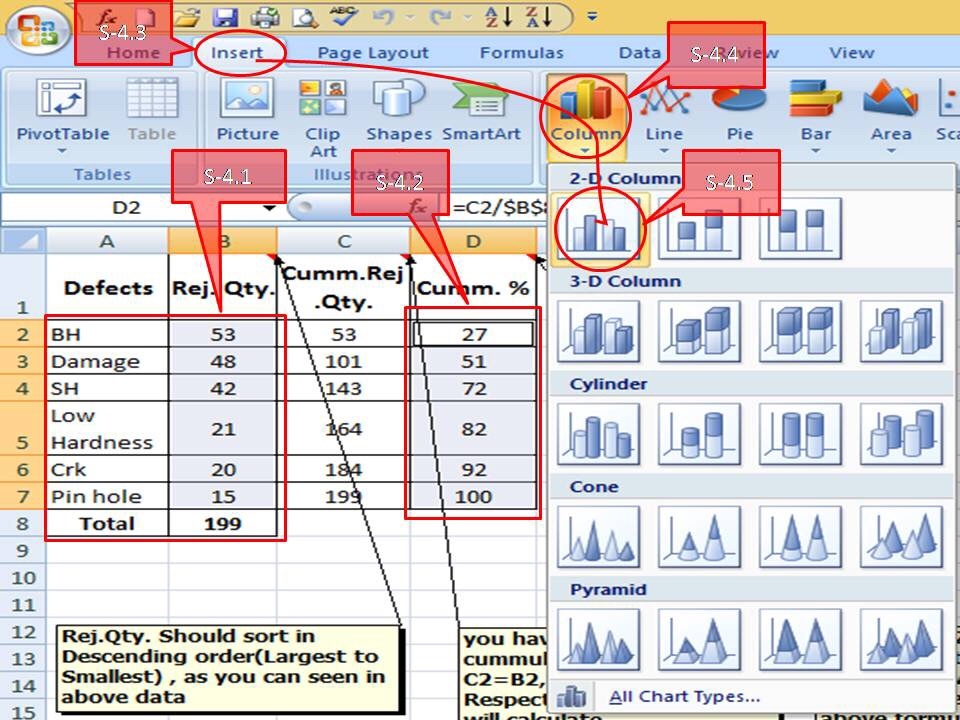
Now you have to select defects, rejection quantity, and cumulative % column as per the above, and then go to the insert column and select the bar chart. Simply follow the steps(From S-4.1 to S-4.5) given in above.
Step -3
After selecting the bar chart, just follow the steps (select “insert” in the Excel sheet then line and finally select the “Line” graph) as described below ( convert the red colour bar into the line Chart )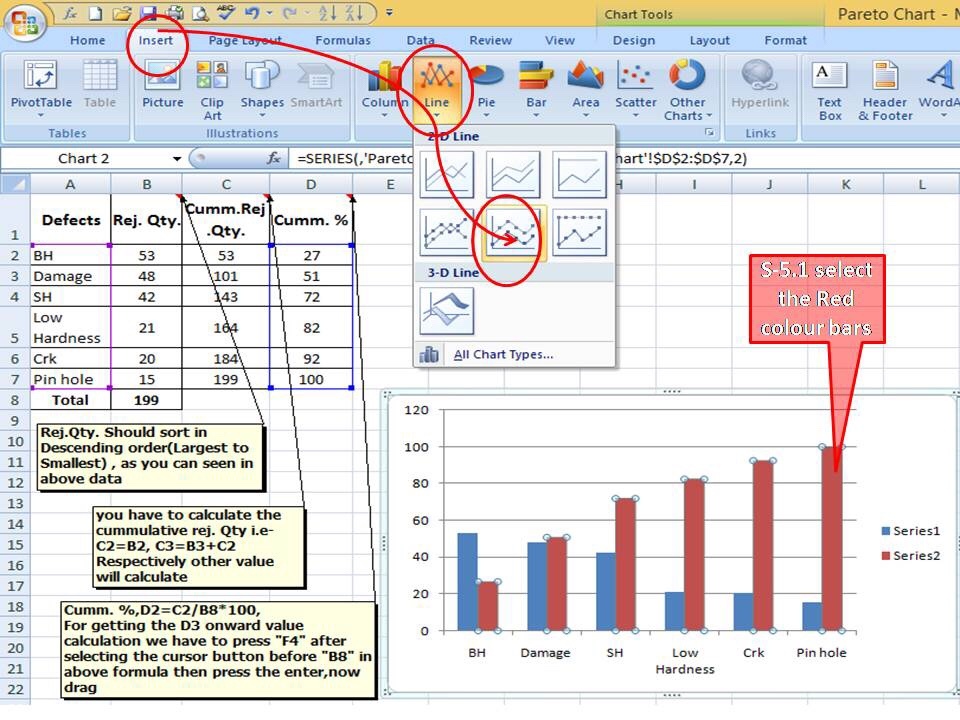
After the conversation of the secondary red colour bar into the Line Chart, the Pareto Chart will be ready to use as

In the above Pareto chart, you can see the bar represents the defect’s Rejection quantity and the line represents the contribution of the cumulative percentage.
Example:
A total of 44 numbers SHE-related incident has been registered in the manufacturing industry in the last couple of financial year. To know the contribution of the individual incidents the SHE officer prepared the Pareto chart. The same Pareto chart is given below.
How do you analyze a Pareto chart?
you can follow the below steps to analyze the Pareto chart;
- Collect the data.
- plot a Pareto chart with the help of the above steps.
- Apply the 80:20 rules/principle.
- select the defects under 80% contribution
- Brainstorm the potential cause.
- Do the hypothesis test or validate the potential cause to find out the significant cause.
- Do the RCA
- Take the action plan
- Implement the plan.
- Monitor the effectiveness.
Example-2 of How to Plot Pareto Chart in Excel
Plot the Pareto chart of the given below data.
| Defects | Rejection Quantity |
| A | 100 |
| B | 80 |
| C | 70 |
| D | 50 |
| E | 30 |
follow the below steps to plot the Pareto chart
Step-1:
First of all, calculate the cumulative rejection quantity
| Defects | Rejection Quantity | Cumulative Rejection Quantity |
| A | 100 | 100 |
| B | 80 | 180 |
| C | 70 | 250 |
| D | 50 | 300 |
| E | 30 | 330 |
Step-2:
calculate the cumulative rejection %
| Defects | Rejection Quantity | Cumulative Rejection Quantity | Cumulative rejection % |
| A | 100 | 100 | 30 |
| B | 80 | 180 | 55 |
| C | 70 | 250 | 76 |
| D | 50 | 300 | 91 |
| E | 30 | 330 | 100 |
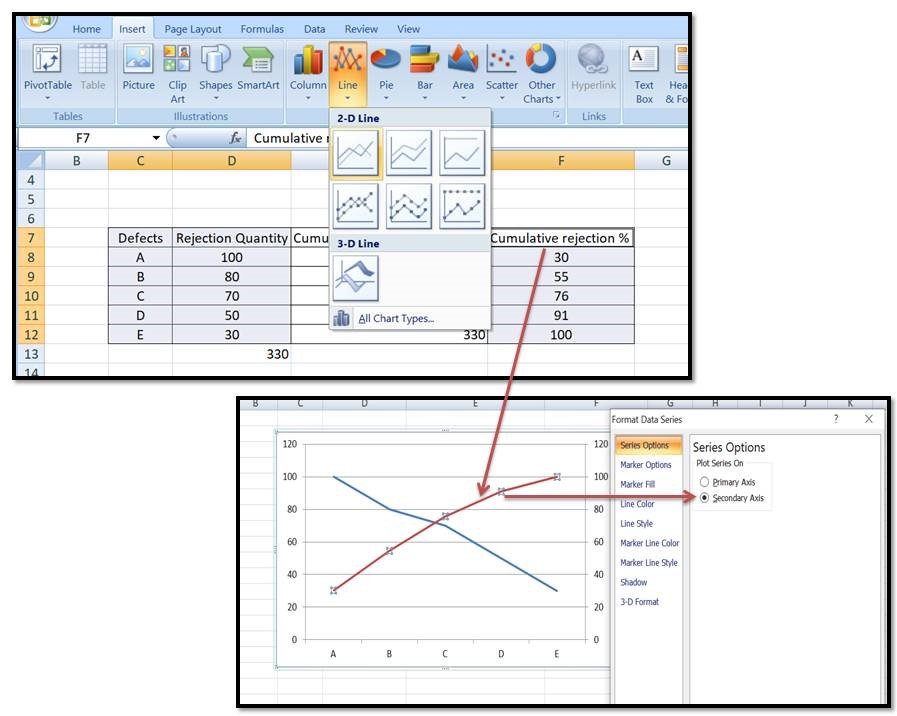
Step-3:
Select the Defects, Rejection quantity, and cumulative rejection % column, and then go to the Insert—>>Line chart. once you select the line chart then, select the cumulative rejection% line chart as the secondary axis. go through the below image for a better understanding.
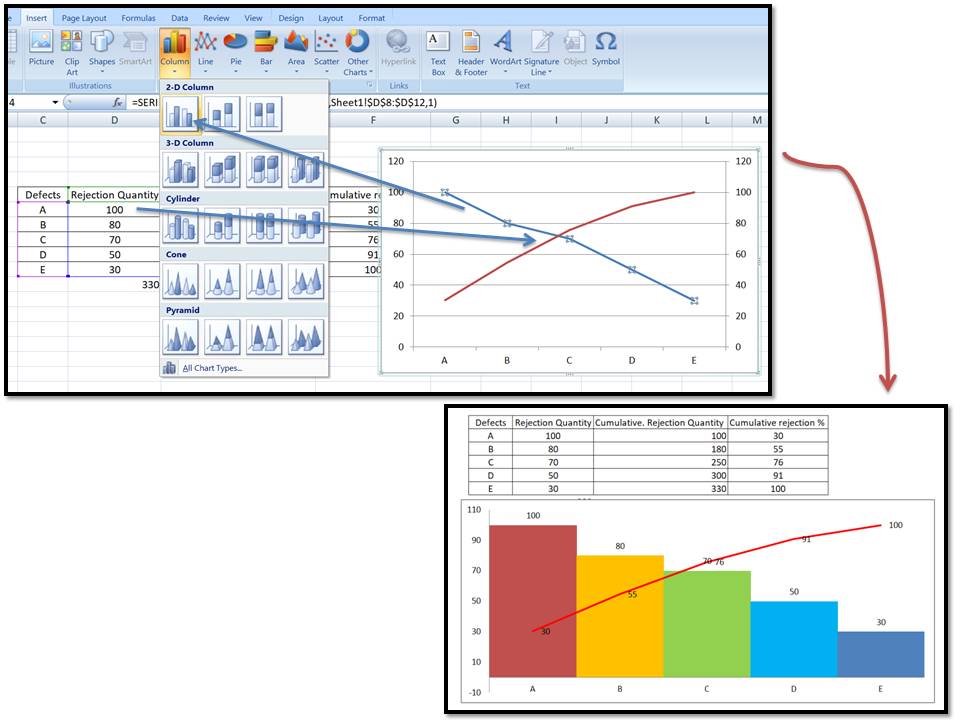
Step-4:
Select the rejection quantity line chart and then, go to the insert——>>Column chart. now the Pareto chart is ready, if you want to customise the colour, and gap then do it manually for a better visual effect.
Some useful Articles;
Pareto Chart Example of Manufacturing Units.
Control Chart Excel Template |How to Plot Control Chart in Excel | Download Template.
SPC Format |DOWNLOAD Excel Template of SPC Study.
7QC Tools Excel Template |DOWNLOAD Format
More on TECHIEQUALITY


Thank you for reading…keeps visiting Techiequality.Com
Popular Post:

Shanti Gopal Pradhan is an experienced professional in Quality Management Systems, QA, Operations, Business Excellence, and Process Improvement. He has strong expertise in international standards including IATF 16949, ISO 9001, ISO 14001, ISO 45001, and ISO 17025, along with methodologies such as TQM, TPM, and Six Sigma.
He holds a degree in Mechanical Engineering along with an MBA, combining strong technical acumen with strategic business insight, he is a Certified Internal Auditor, Lead Auditor, and Six Sigma Black Belt, with a proven track record in driving quality transformation and operational excellence.