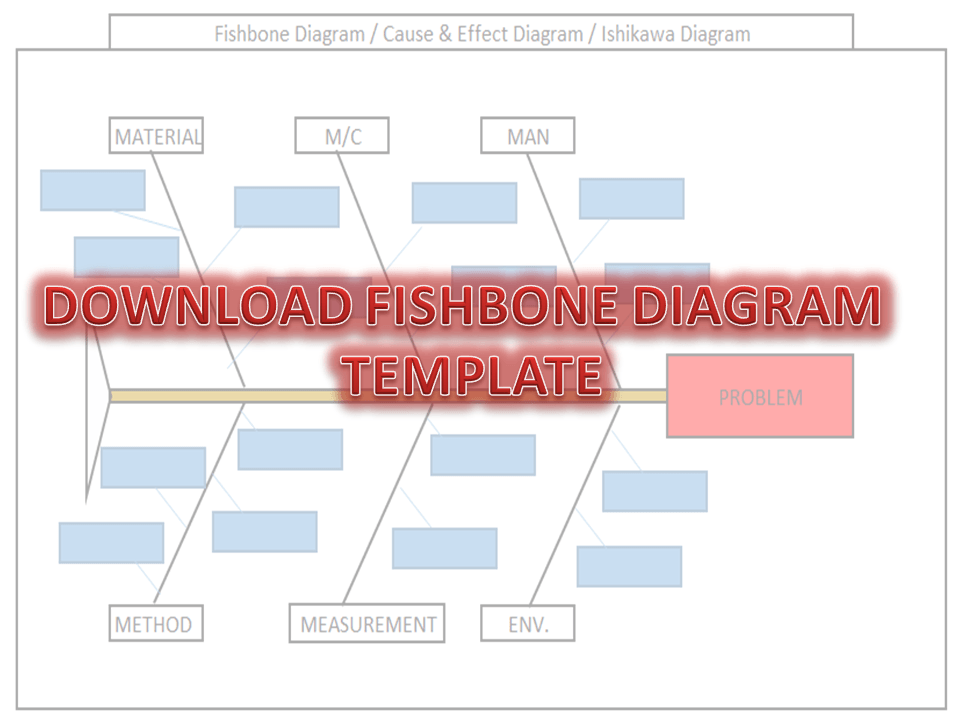
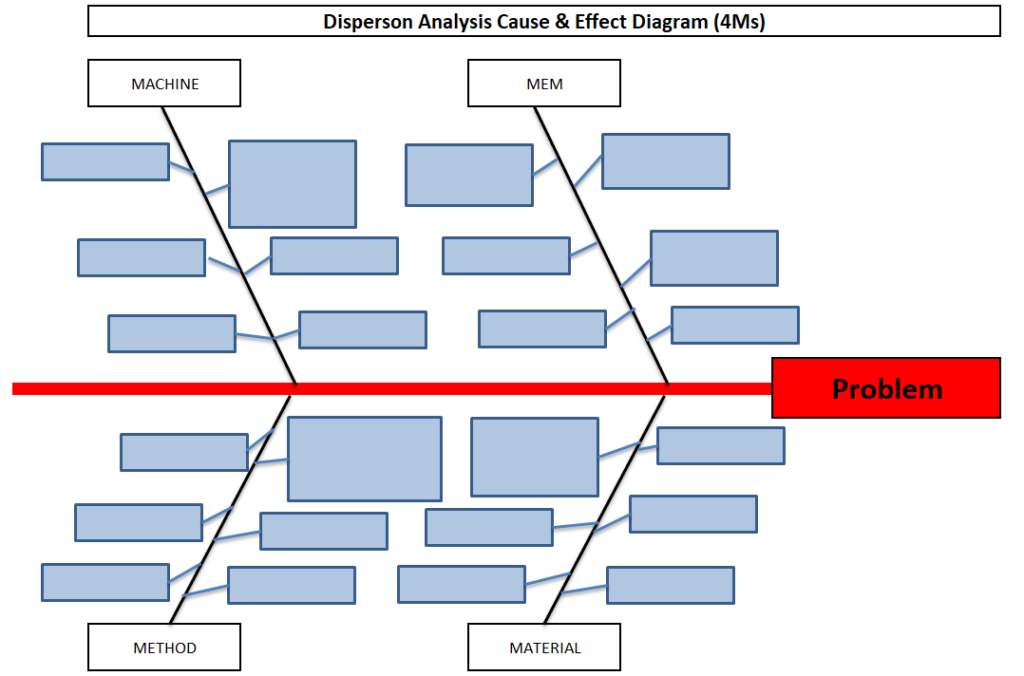
Dispersion Analysis & Process Classification Cause & Effect Diagram Template
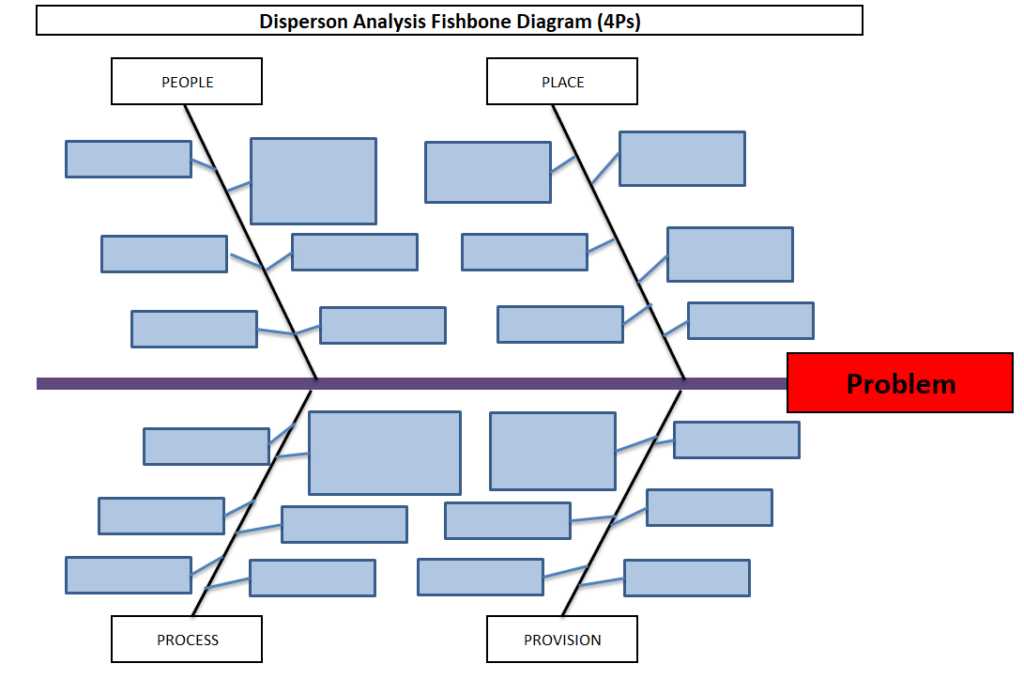
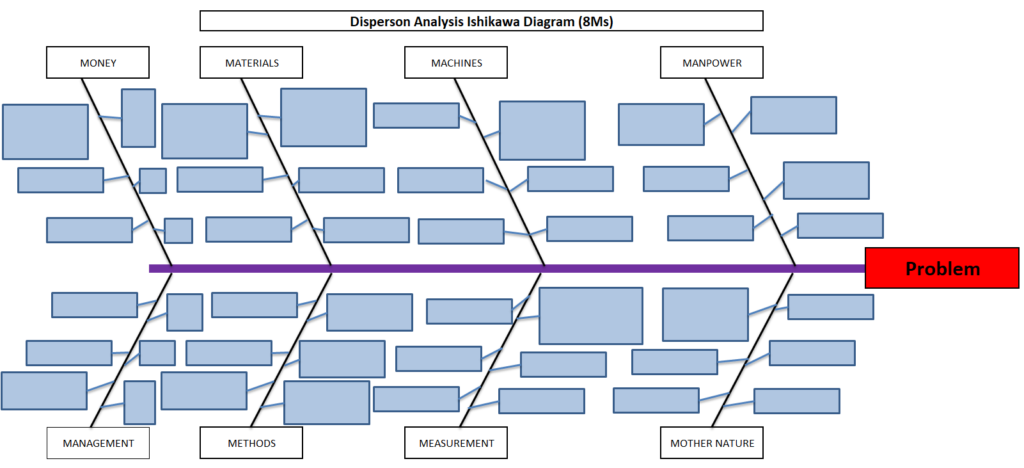
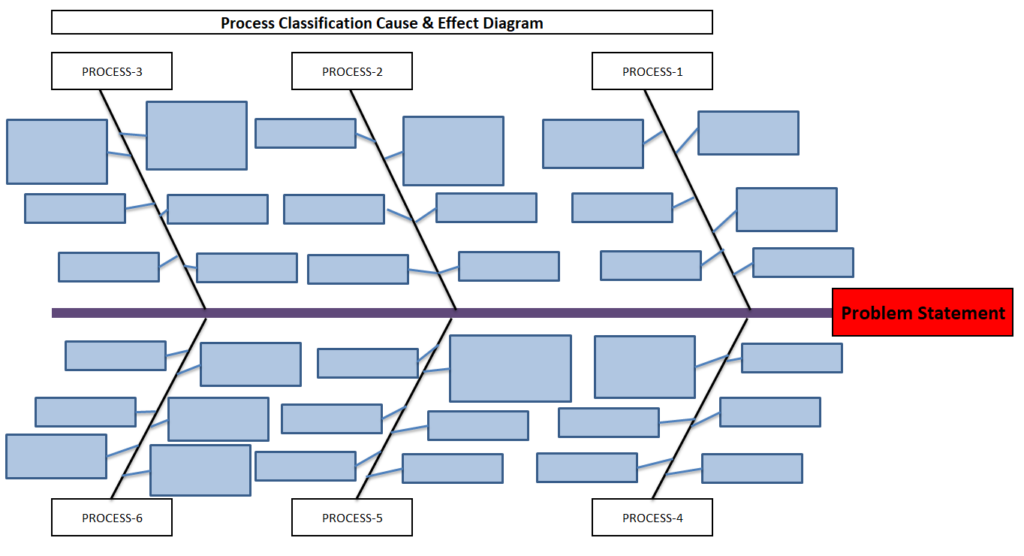
Hi readers! Today we will discuss on types of Cause & Effect Diagram/Fishbone diagram. The cause and effect diagram is the most popular and frequently used tool among the seven QC tools. Basically Fishbone diagram is classified into mainly two types as [1] Dispersion Analysis Cause and Effect diagram, and [2] Process Classification Fishbone diagram. The Dispersion analysis fishbone diagram involves identifying the potential cause for a specific quality problem. However, a Process classification cause & effect diagram involves establishing causes related to the Process. In the manufacturing industry, both types of diagrams are used but Dispersion types are most frequently used to identify the potential causes of the quality-related problems. If you are interested in downloading the Dispersion Analysis Cause & Effect Diagram Template & Process Classification fishbone diagram, then click on the given below links.
DOWNLOAD– Dispersion analysis cause & effect diagram template. (4Ms).
Dispersion analysis Fishbone Diagram Excel Template. (4Ps)-DOWNLOAD.
DOWNLOAD– Dispersion analysis cause & effect diagram format. (8Ms).
Process Classification cause & effect diagram excel format-DOWNLOAD.
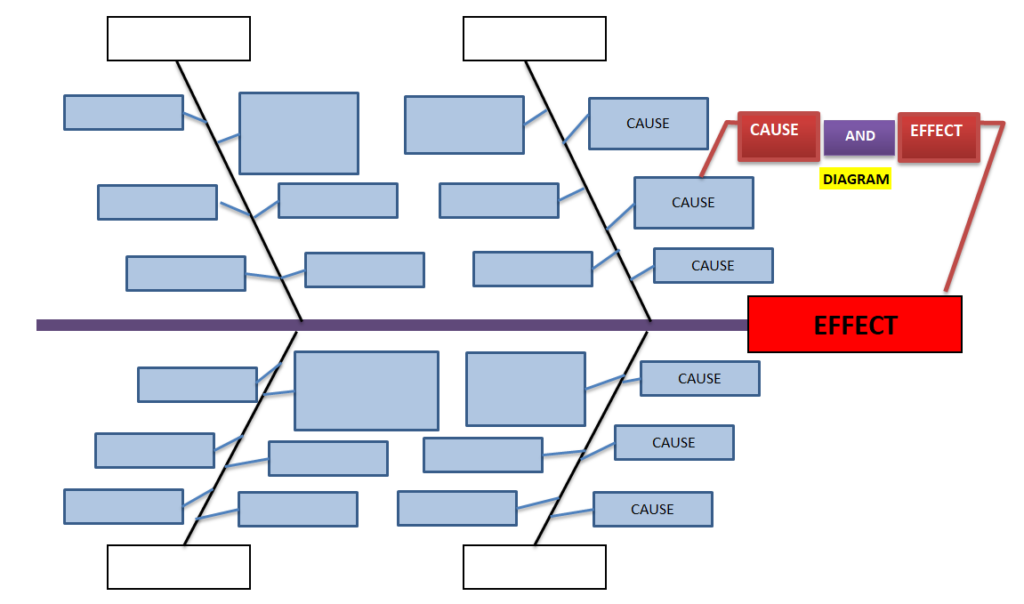
Steps for construction of Cause & Effect Diagram:
- Form a CFT- Team with a multifunctional experienced workforce.
- The facilitator will listen carefully to the member’s potential causes to represent it in a diagram.
- Draw a backbone line from left to right, terminating at the Head, and write the Problem statement.
- Draw the small bone and write the potential cause.
Advantages:
- It helps to identify the potential cause to improve the process.
- Helps in the root cause identification of the problem.
- C&E diagram is easily constructed & understood.
- It is an effective tool for the diagnosis of the various causes of the problem and helping to solve the problem.
Disadvantages:
- Waste of time to identify the other causes that are not critical to the Problem.
- It’s a time-consuming methodology.
Dispersion Analysis Cause & Effect diagram V/S Process Classification Fishbone diagram:
Useful Links:
Strategies for Manufacturing Process Improvement |11+ Strategies
7QC Tools for Problem Solving | What are 7 QC Tools
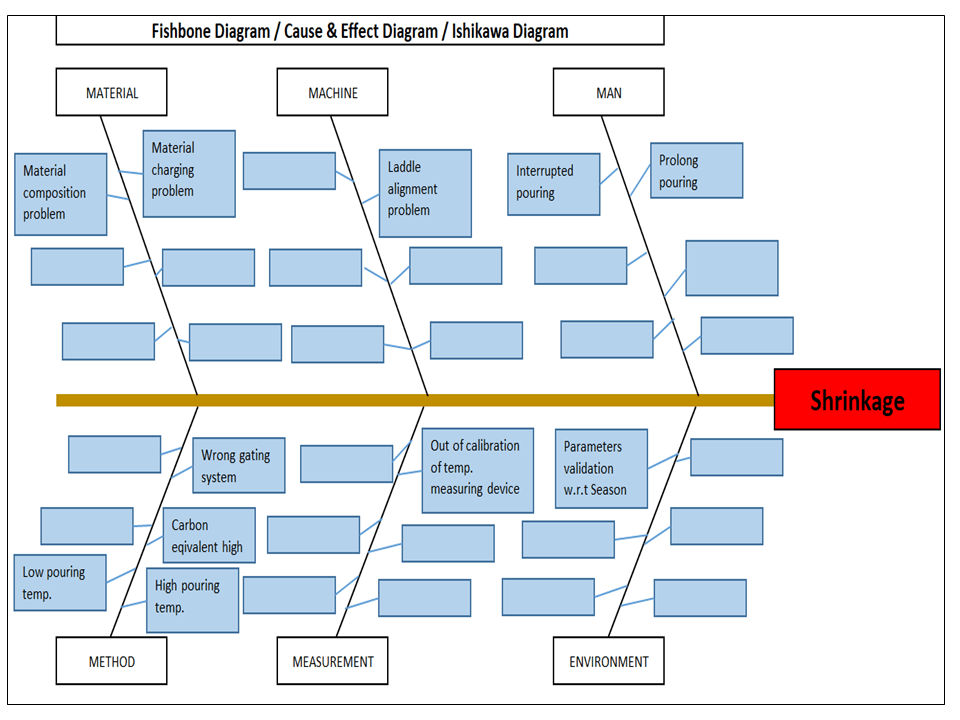
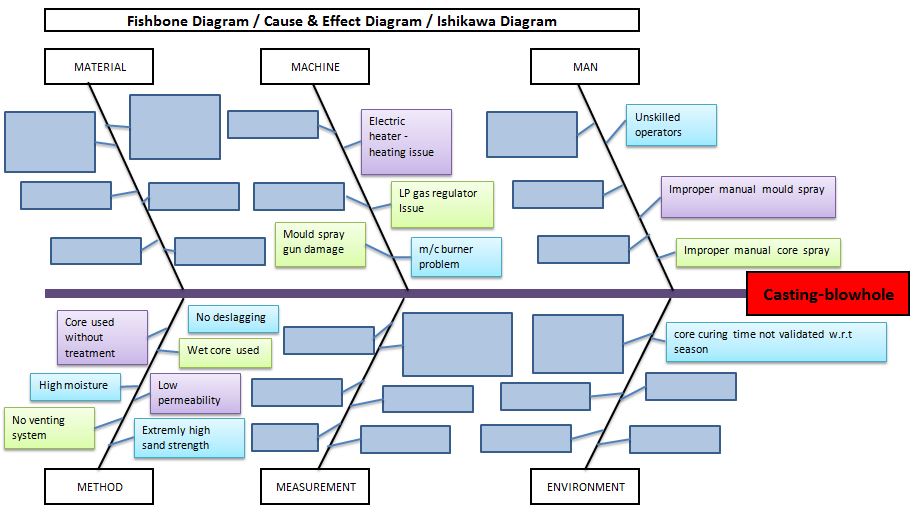
Fishbone Diagram Template With Example
Root Cause Analysis | 8 Steps of RCA
More on TECHIEQUALITY


Thanks for Reading…Keep visiting Techiequality.Com
Popular Post

Shanti Gopal Pradhan is an experienced professional in Quality Management Systems, QA, Operations, Business Excellence, and Process Improvement. He has strong expertise in international standards including IATF 16949, ISO 9001, ISO 14001, ISO 45001, and ISO 17025, along with methodologies such as TQM, TPM, and Six Sigma.
He holds a degree in Mechanical Engineering along with an MBA, combining strong technical acumen with strategic business insight, he is a Certified Internal Auditor, Lead Auditor, and Six Sigma Black Belt, with a proven track record in driving quality transformation and operational excellence.