Pareto Chart Excel Template | Step by Step guide of template usages:-
Hi Readers! In this article, we have discussed on Pareto Chart Excel Template with a manufacturing example. and also you can learn here, the Pareto chart principle (80/20 rule). if you would like to download our excel template or format then, go through the below link.
Download–Pareto chart Excel Template.
[Figure 1]
How to Use Pareto Chart Excel Template:
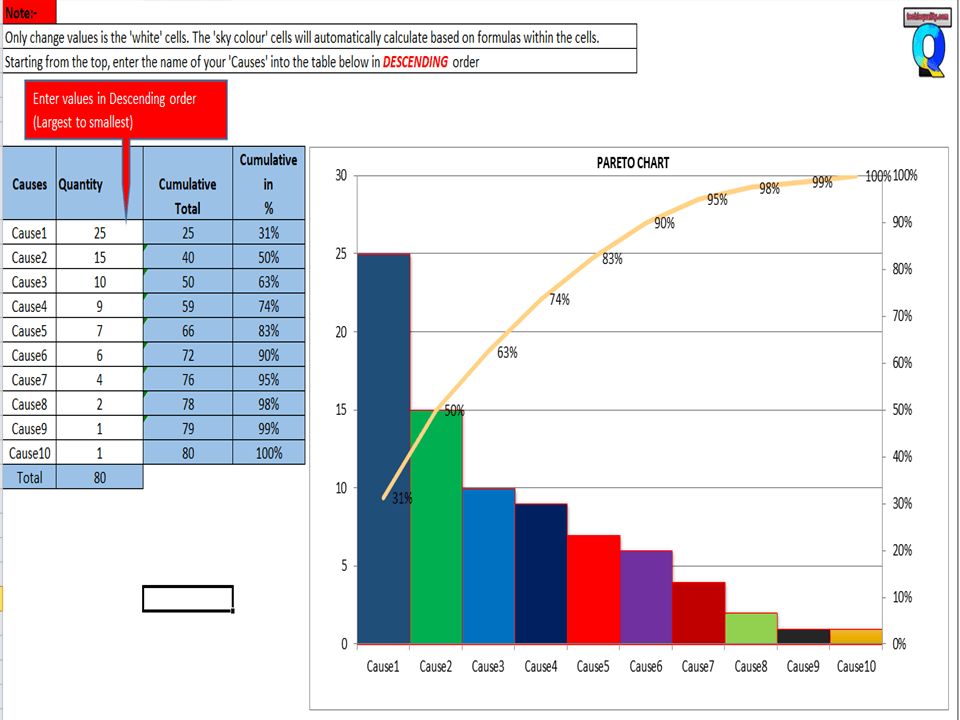
After downloading, the above Pareto Chart Excel Template Carefully read the Note and red highlighted box marked in excel.
Note 1:- White cells are only changed values. The sky colour cells will automatically calculate based on the formula within the cells.
Note 2:- Starting from the top, enter the name of causes into the table below in descending order (Largest to Smallest Values)
Example of Pareto chart:
Let us have ten causes as Damage, Crack, Shrinkage, Short-run, Blowhole, Pin-hole, Extra Metal, Sand-wash, Rough Surface, Low hardness, and High elongation.
| Causes | Rejection Quantity |
| Damage | 23 |
| Shrinkage | 20 |
| Crack | 11 |
| Short-run | 7 |
| Blow-hole | 8 |
| Extra Metal | 5 |
| Sand wash | 6 |
| Rough surface | 3 |
| Low hardness | 4 |
| High elongation | 1 |
Now you have to do the sorting of Rejection Quantity in Descending order (Largest to smallest value)
Descending order of Rejection Quantity of above causes are,-
| Causes | Rejection Quantity |
| Damage | 23 |
| Shrinkage | 20 |
| Crack | 11 |
| Blow-hole | 8 |
| Short-run | 7 |
| Sand wash | 6 |
| Extra Metal | 5 |
| Low hardness | 4 |
| Rough surface | 3 |
| High elongation | 1 |
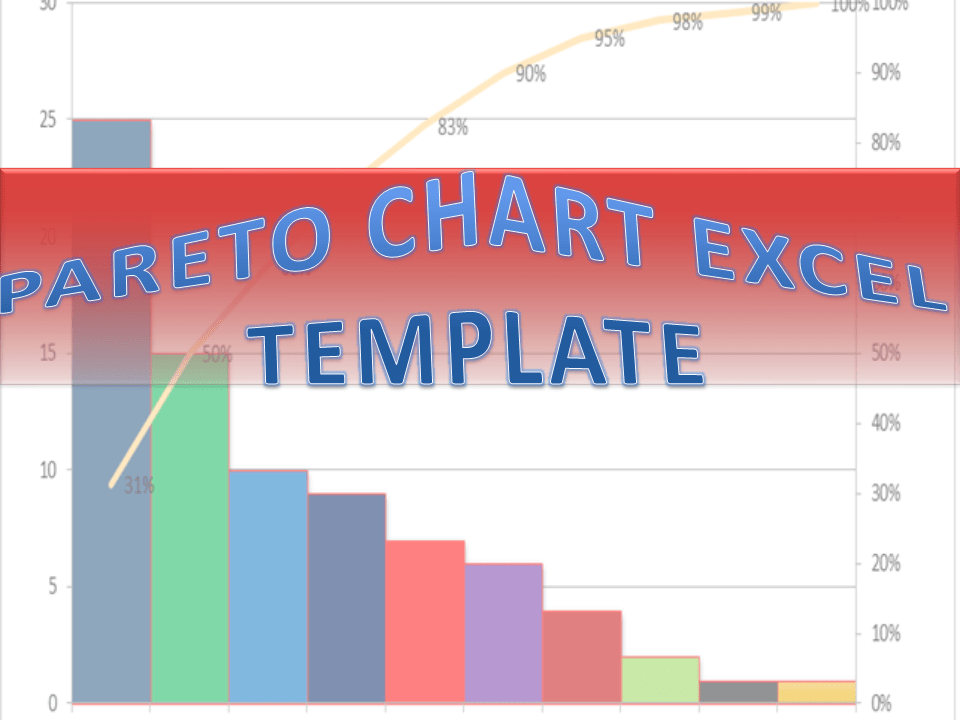
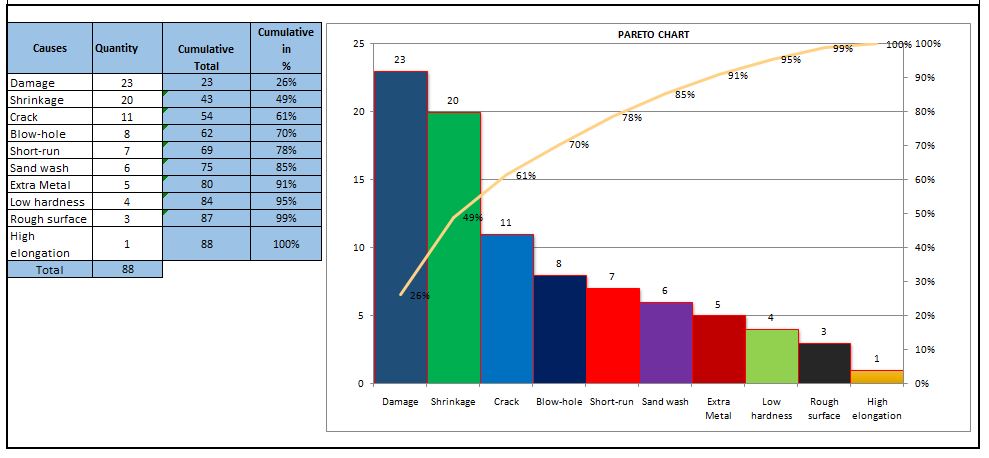
Now directly we have to enter the name of causes and Rejection quantity (After sorting the value in descending order) into white cells of the Excel template sheet. After entering the values the Pareto chart will look like as below.
Pareto Principle (80/20 Rule):-
The 80/20 Rule or Pareto Principle is the most important part of Pareto Analysis. The rule 80/20 says that 80% of the effects come from 20% of the causes.
In Italy, Vilfredo Pareto has originally observed that 20% of people were owned 80% of the land. This principle was applied to quality control and favoured the use of the statement of phrase, which is “The Vital few and useful many” to define the 80/20 rule in the 20th century by Dr. Joseph M. Juran. Nowadays this principle is so popular and very useful in describing the contribution of the causes.
Understanding of Principle:-
Let’s get started with this principle, and how it is applicable in different sectors like manufacturing and non-manufacturing unit or service sectors. This principle is not limited to any particular sector or unit’s problems or defects to identify the contribution. It will help you to resolve 80% of problems/causes/defects among the 100% of problems.
How this principle is related to the different fields: – (Example)-
- Filed failure (for example (a)-80% of the field failure comes from 20% of the Causes.
(b)-80% of the field failure comes from 20% of the Customer).
- 80% of the results come from 20% of the Team.
- Risk Management (e.g. 80% of the Risk comes from 20% of the Causes).
Let us have ten types of Causes and individual causes having a number of defects. Now we need to work on merely an 80% contribution to resolve the problem. But the things are how to identify the causes those are coming under the 80% contribution. So to identify the contribution we need to use the Pareto chart for knowing the contribution. So I would recommend you to download the above Pareto Chart Excel Template then, follow the steps and identify the contribution.
Advantages of Pareto Chart:
1. Production Optimisation.
2. Rejection Reduction.
3. Cost of Poor Quality Reduction.
4. Quality level Improvement.
5. Product Performance Improvement
6. Customer satisfaction Enhancement.
7. Rework cost reduction.
Etc.
The Pareto chart is the most commonly used tool in manufacturing industries, I remember when I was working in the quality department, how frequently I used this tool in our daily quality issue analysis. I used this tool on a daily line rejection analysis, as well as in different types of QA or QC projects like quality circle projects, SGA projects, Six Sigma projects, etc. With the help of the Pareto chart, you can easily visualize the defect’s contribution and accordingly, you can do an analysis of the majority contribution for improvement.
FAQ:
The Pareto chart is one of the commonly used 7 QC tools in manufacturing industries.
Similar Articles:
Histogram Example | Foundry Industries Examples.
Histogram Template with example | Download.
How to plot Histogram in Excel (Step by step guide with example)
SPC Format |DOWNLOAD Excel Template of SPC Study
7QC Tools for Problem Solving | What are 7 QC Tools
Root Cause Analysis | 8 Steps of RCA
More on TECHIEQUALITY



Thanks for reading…Keeps Visiting Techiequality.Com
Popular Post:

Our Author is an experienced professional in Quality Management Systems, Quality Assurance, Operations, and Business Excellence, with cross-industry expertise in Automotive, AMR, Robotics, Battery Manufacturing, Foundry, and Sheet Metal industries. He has strong expertise in international standards including IATF 16949, ISO 9001, ISO 14001, ISO 45001, and ISO 17025, along with methodologies such as TQM, TPM, and Six Sigma. He holds a degree in Mechanical Engineering along with an MBA, combining strong technical acumen with strategic business insight, he is a Certified Internal Auditor, Lead Auditor, and Six Sigma Black Belt, with a proven track record in driving quality transformation and operational excellence.
Through TECHIEQUALITY, he shares practical insights, quality tools, and industry best practices to help professionals improve processes and achieve operational excellence.