
Correlation Analysis Example and Interpretation of Result
Hi readers! Today we will discuss on Correlation Analysis Example and Interpretation of the Result, let me tell you one thing correlation analysis is generally used to know the correlation between two variables. We have published two articles on how to do correlation analysis in Excel and Minitab (both links are given below). But here in this tutorial, we will explain to you the Interpretation of correlation results with industrial examples.
How to do correlation analysis in excel? Step by step guide.
Correlation analysis in Minitab? Step by step guide.
Correlation Analysis Example and Interpretation of Result:
We have explained here both positive and negative correlation analyses with industrial examples. Details are given below.
Example-1:
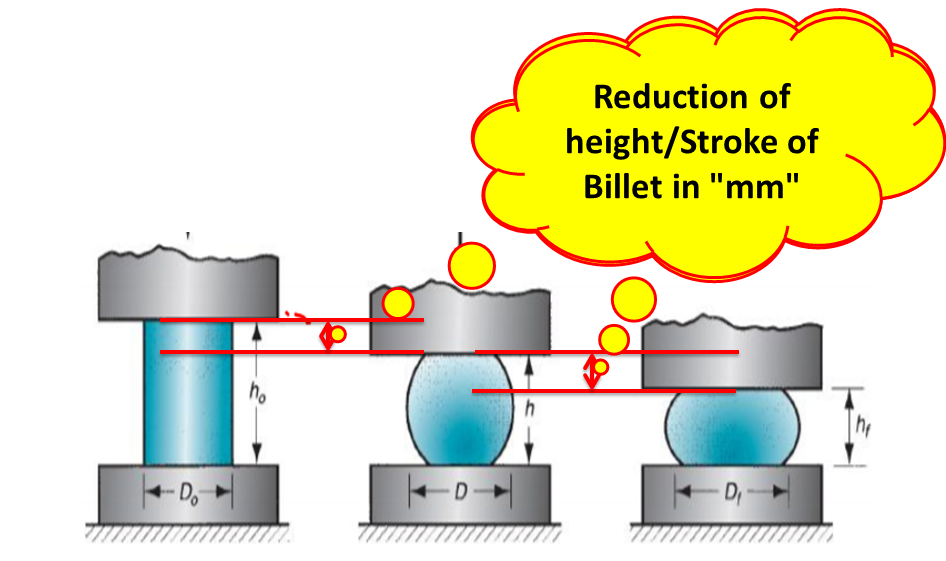
The Forging force has been applied in the billet at four different stages, as you can see in the above figure. At every stage, there is a reduction of height per stroke of the billet. The original height of the billet is 140.0mm. The details data for every stage is mentioned in the below table.
| Forging Force in “N” | Reduction of height/Stroke of Billet in “mm” |
| 500 | 6.5 |
| 750 | 19.5 |
| 1000 | 30 |
| 1250 | 36 |
We are going to analyze the correlation test of the above two variables i.e. “forging force vs reduction of the height of billet” by two different methods [1] Analysis by Excel [2] analysis by Minitab.
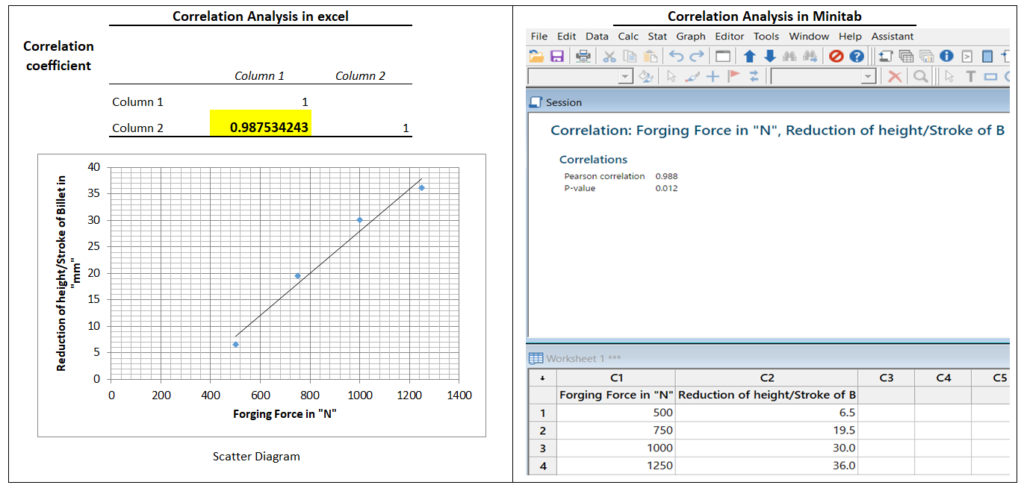
Note that in both the methods, the correlation coefficient value is 0.98; it means the value lies between 0.91 to 1.0, which indicates us there is a perfect positive correlation between the two variables.
Example-2:
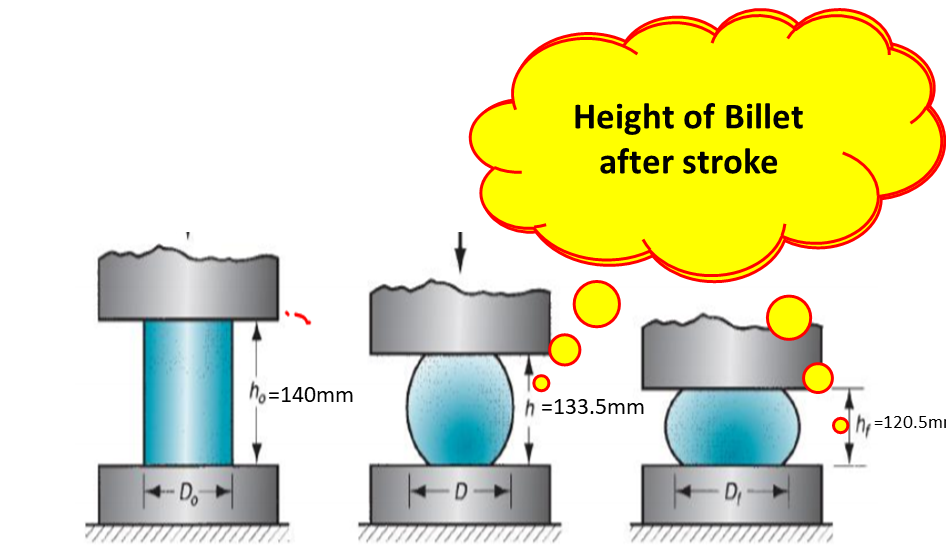
This example is part of Example-1, here we are going to analyze the correlation between the forging force applied and the height of the billet after each stroke in two different methods (both in Excel and Minitab). A Data table is given below;
| Forging Force in “N” | Height of Billet after stroke |
| 500 | 133.5 |
| 750 | 120.5 |
| 1000 | 110 |
| 1250 | 104 |
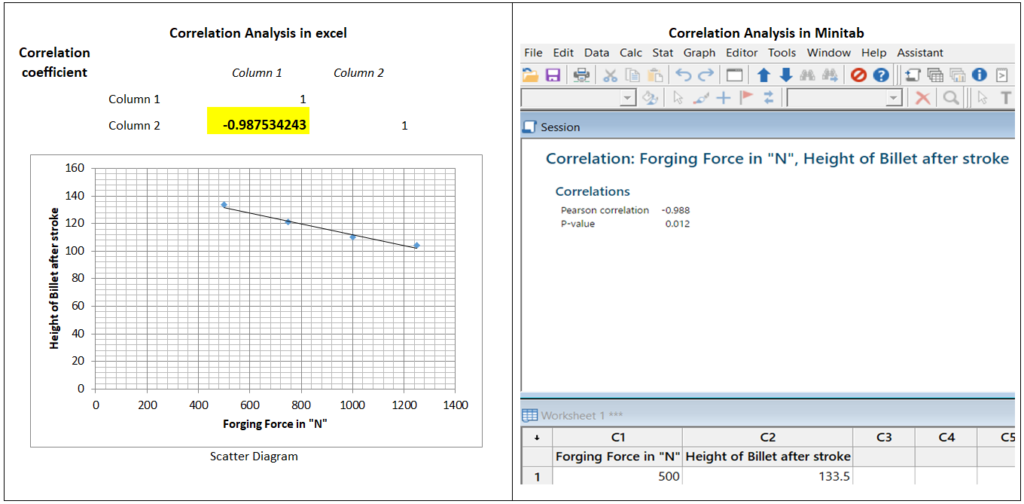
Note that in both methods, the correlation coefficient value is -0.98; it means the value lies from -0.91 to -1.0, which indicates us there is a perfect negative correlation between the two variables.
Example-3:
A company ABC Ltd has advertised its product for seven months at different frequencies and respectively collected the sales volume to know the effectiveness of advertisement against sales quantity. Details data is given below;
| Advertisement frequency/month in days of last 7 months | Sales Quantity |
| 10 | 10000 |
| 8 | 30000 |
| 15 | 72000 |
| 20 | 55000 |
| 6 | 15000 |
| 9 | 80000 |
| 11 | 15000 |
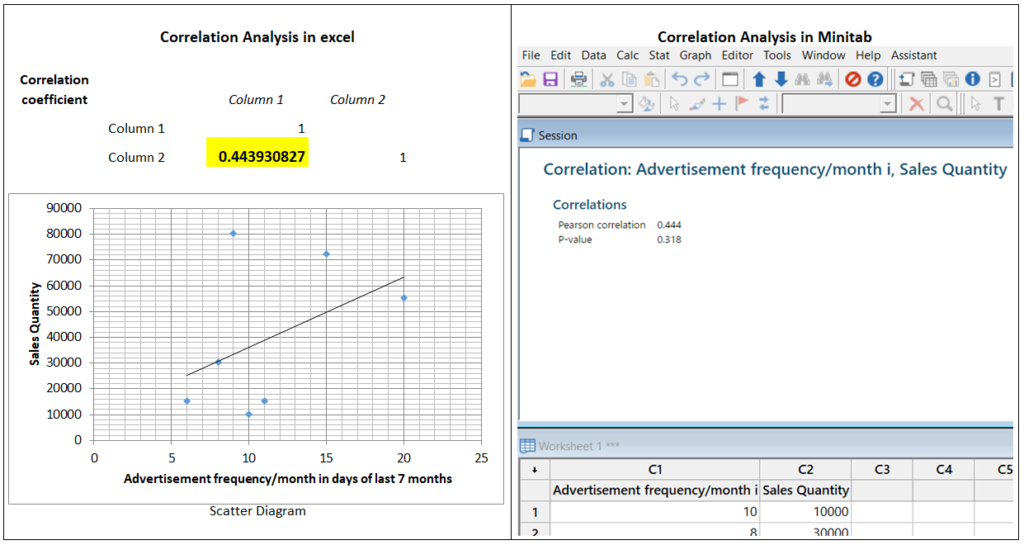
Note that in both the methods, the correlation coefficient value is 0.44; it means the value lies in 0.00 to 0.5 (refer the Table-A), which indicates us there is a low positive correlation between the two variables.
Interpretation of Correlation coefficient (r):
| Correlation Coefficient (r ) | Interpretation |
| r=0.5 | Low positive correlation |
| r=0.9 | High positive correlation |
| r=1 | Perfect positive correlation |
| r=0 | No correlation |
| r= -0.5 | Low negative correlation |
| r= -0.9 | High negative correlation |
| r= -1 | Perfect negative correlation |
Table-A
Free Templates / Formats of QM: we have published some free templates or formats related to Quality Management with manufacturing / industrial practical examples for better understanding and learning. if you have not yet read these free template articles/posts then, you could visit our “Template/Format” section. Thanks for reading…keep visiting techiequality.com
More on Techiequality


Shanti Gopal Pradhan is an experienced professional in Quality Management Systems, QA, Operations, Business Excellence, and Process Improvement. He has strong expertise in international standards including IATF 16949, ISO 9001, ISO 14001, ISO 45001, and ISO 17025, along with methodologies such as TQM, TPM, and Six Sigma.
He holds a degree in Mechanical Engineering along with an MBA, combining strong technical acumen with strategic business insight, he is a Certified Internal Auditor, Lead Auditor, and Six Sigma Black Belt, with a proven track record in driving quality transformation and operational excellence.