Different Types of Fishbone Diagram:
Hi readers! Today we will discuss on Types of Fishbone Diagram. Basically, the fishbone/ cause & Effect/Ishikawa diagram is one of the most popular tools among 7QC Tools. Due to the simplicity and easy understanding, almost all sectors (manufacturing, service sector, non-manufacturing) are using this tool for represent the potential cause of a Problem statement. It’s an effective tool for the diagnosis of the various causes of the problem and helping to solve the problem. You can download the all types of C&E Diagram Template/formats from the below links.
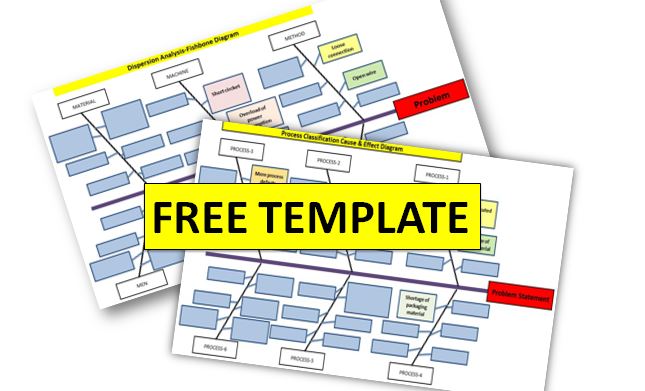
DOWNLOAD– Cause & Effect Diagram Template (DA, E & PC types).
Types of Fishbone Diagram/ Cause & Effect/ Ishikawa Diagram:
Three basic types of Fishbone Diagrams are [1] Dispersion Analysis [2] Process Classification [3] Enumeration. Dispersion analysis type of cause and effect diagram involves identifying and classifying possible causes for a specific quality problem. For example, 4Ps, 4Ms, 8Ms, and 4M1E are the most popular pattern of dispersion analysis fishbone diagrams. Some sample pattern templates are given below;
The Process classification fishbone diagram involves establishing causes related to the Process. But in Enumeration types, there a slight changes as compared to the above both types, simply list all the possible causes first and then draw the chart in order to relate the causes to each other.
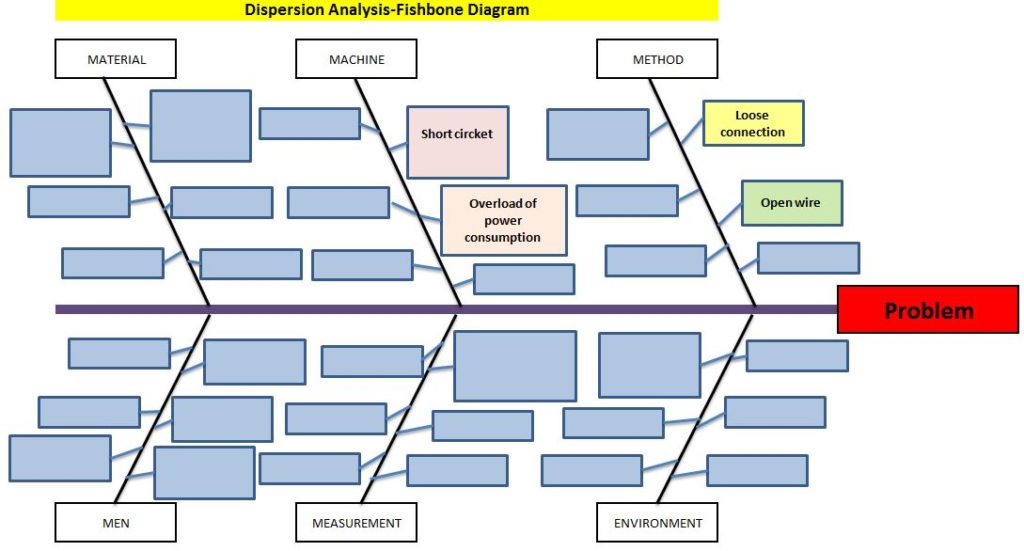
Example of Dispersion analysis type of cause and effect diagram:
We have built the two popular C&E diagrams considering with two scenarios as [1] Electric fire [2] Product delivery issues. First of all, we have listed up the potential causes and then constructed the fishbone diagram.
Problem Statement: Electric Fire.
Potential Causes:
- Loose connection,
- Open wire,
- Short circuit
- Overload of power consumption.
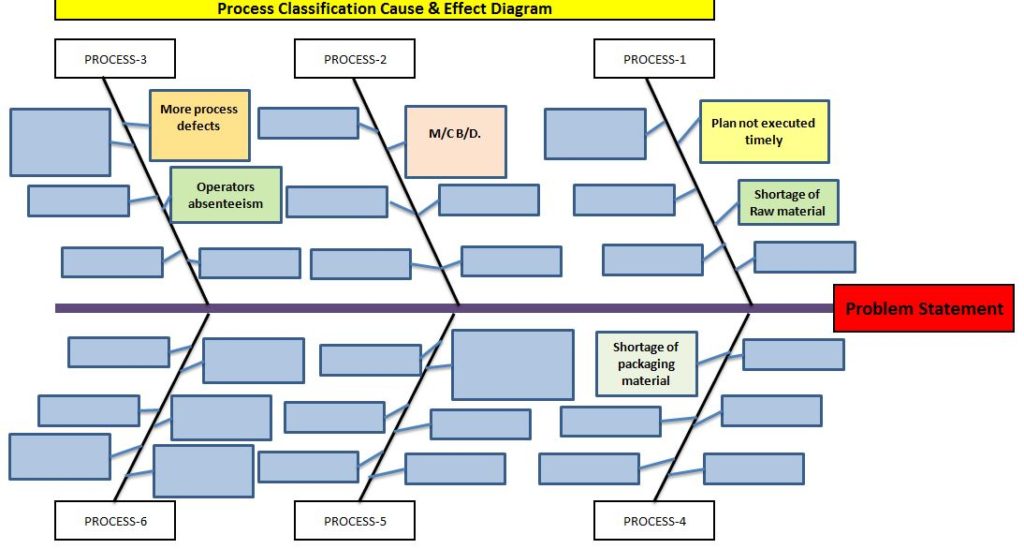
Example of Process classification cause and effect diagram:
Problem Statement: Delayed Delivery.
Potential Cause:
Process-1:
- Plan not executed timely.
- Shortage of Raw material.
Process-2:
- M/C B/D.
Process-3:
- More process defects
- Operators absenteeism
Process-4:
- Shortage of packaging material.
FAQ:
What are the 3 types of cause and effect diagrams?
Ans. The common three types of fishbone or cause & effect diagrams are 1-Dispersion Analysis, 2- Process Classification, and 3-Enumeration.
Free Templates / Formats of QM: we have published some free templates or formats related to Quality Management with manufacturing / industrial practical examples for better understanding and learning. if you have not yet read these free template articles/posts then, you could visit our “Template/Format” section. Thanks for reading…keep visiting techiequality.com
More on TECHIEQUALITY


Popular Post:

Shanti Gopal Pradhan is an experienced professional in Quality Management Systems, QA, Operations, Business Excellence, and Process Improvement. He has strong expertise in international standards including IATF 16949, ISO 9001, ISO 14001, ISO 45001, and ISO 17025, along with methodologies such as TQM, TPM, and Six Sigma.
He holds a degree in Mechanical Engineering along with an MBA, combining strong technical acumen with strategic business insight, he is a Certified Internal Auditor, Lead Auditor, and Six Sigma Black Belt, with a proven track record in driving quality transformation and operational excellence.