Simple Moving Average Formula | Calculation | Excel Template | Example:
A simple moving average (SMA) is a method to get an overall idea about the forecast value of future prediction. If you are planning for Sales, Manpower planning, Production planning, marketing, etc. then SMA will be helping you to forecast future planning. So easily you can do future plans in your business area with the help of expected value based on past demands. In this article, we will be covering the simple moving average formula, calculation, and type of errors with examples. Also, we shall describe how to calculate MA (moving average) with the help of an excel sheet (Data analysis method and function Method).
DOWNLOAD-Sample Example of Moving Average Excel Template.
Simple Moving Average Formula (SMA):
If you would like to calculate the forecast for the coming period based on the Simple Moving Average Method, then formula {F (t, n)} will be the sum of Actual Occurrences or Demands in the past period up to “n” periods divided by the number of periods to be averaged.
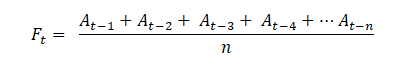
Where, F = Forecast for the upcoming period.
n = Number of periods to be averaged.
At-1, At-2, At-3 = Actual demands or occurrence in the past period up to “n” periods.
How to calculate simple moving average forecast value?
Let’s use a simple example, suppose a company would like to use a 3-month, 5-month, and 7-month simple moving average for forecasting sales of the company. The actual sales of the last 11 months are given below;
Calculate the Forecast value of December by using a 3-month, 5-month, and 7-month simple moving average method. i.e.
- F=?, (Use 3-month SMA method)
- F =?, (Use 5-month SMA method)
- F =?, (Use 7-month SMA method)
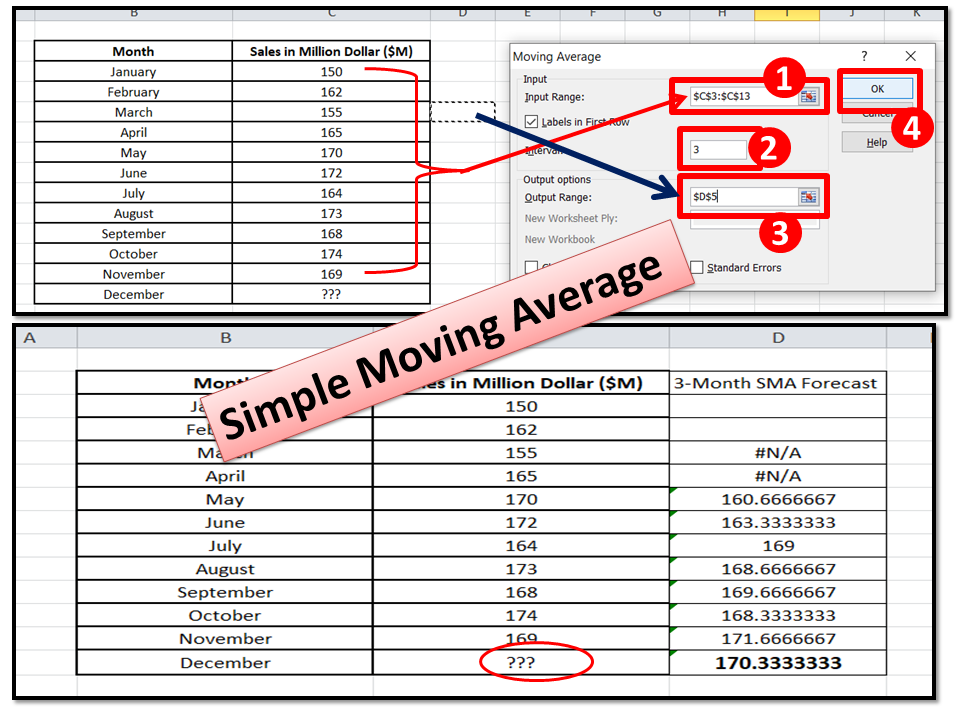
| Month | Sales in Million Dollar ($M) |
| January | 150 |
| February | 162 |
| March | 155 |
| April | 165 |
| May | 170 |
| June | 172 |
| July | 164 |
| August | 173 |
| September | 168 |
| October | 174 |
| November | 169 |
| December | ??? |
Answer:
Where, F = Forecast for the upcoming period.
n = Number of periods to be averaged.
At-1, At-2, At-3 =Actual demands or occurrence in the past period up to “n” periods.
Forecast for December using the 3-month SMA method:
= (169 + 174 + 168)/3
= 170.33
Note: we have calculated the average of the past three month’s sales i.e. sales of November, October, and September.
The past 5-month sales values from July to November are 164, 173, 168, 174 & 169 (See the above table).
Forecast for December using a 5-month simple moving average method:
= (164 + 173 + 168 + 174 + 169)/5
= 169.6
Forecast for December using the 7-month SMA method (May to November):
= (170 + 172 + 164 + 173 + 168 + 174 + 169)/7
= 170
Forecast Table:
| Month | Sales in Million Dollar ($M) | 3-month SMA | 5-month SMA | 7-month SMA |
| January | 150 | |||
| February | 162 | |||
| March | 155 | |||
| April | 165 | |||
| May | 170 | |||
| June | 172 | |||
| July | 164 | |||
| August | 173 | |||
| September | 168 | |||
| October | 174 | |||
| November | 169 | |||
| December | ??? | 170.33 | 169.6 | 170 |
How to calculate different types of SMA errors?
Here, we are going to calculate the main three types of Error i.e. [1] Mean Absolute Deviation (MAD). [2] (MSE) Mean Squared Error. [3] Mean Absolute Percent Error (MAPE). Suppose a company wants to use the 3-month simple moving average method to calculate the forecast value of sales and errors of each month w.r.t actual value. Month-wise sales are given below;
| Month | Sales quantity (Nos.) |
| April | 3000 |
| May | 3500 |
| June | 3300 |
| July | 3400 |
| August | 3450 |
| September | 3501 |
| October | ?? |
By using a 3-month SMA method, we have calculated the forecast sales quantity from July to October as mentioned in the below table.
| Month | Sales quantity (Nos.) | 3-month SMA Forecast |
| April | 3000 | |
| May | 3500 | |
| June | 3300 | |
| July | 3400 | 3266.67 |
| August | 3450 | 3400 |
| September | 3501 | 3383.33 |
| October | ?? | 3450.33 |
Now, we have to calculate the Error from July to September simply by subtracting the 3-month SMA forecast value from the Actual sales quantity.
Error of July = 3400 – 3266.67
= 133.33
August error value = 50
September error value = 117.67
There is no negative error value, so no need to calculate the absolute value, else calculate the absolute value.
Mean Absolute Deviation (MAD) = (133.33 + 50 + 117.67) / 3
= 100.33
Mean Squared Error (MSE) = (133.33²+ 50² + 117.67²) / 3
= (17776.89 + 2500 + 13846.22) /3
=11374.37
Absolute percent error of July = (133.33/3400) X 100
= 3.92
Absolute percent error of August = (50 /3450) X 100
= 1.45
Absolute percent error of September = (117.67 /3501) X 100
= 3.36
Mean Absolute Percent Error (MAPE) = (3.92 + 1.45 + 3.36) / 3
= 2.91%
How to calculate an SMA forecast in an Excel sheet using a data analysis option?
We have taken the same data table that was already considered for example and also we will cross-check the forecast value of both the methods (manual and Excel data analysis) by using a 3-month simple moving average.
Step-1: Open the Excel sheet and then follow the below options as;
- Click on the “Data” option in the Excel sheet.
- Enter on the “Data Analysis” option.
- Select the “Moving Average “ option.
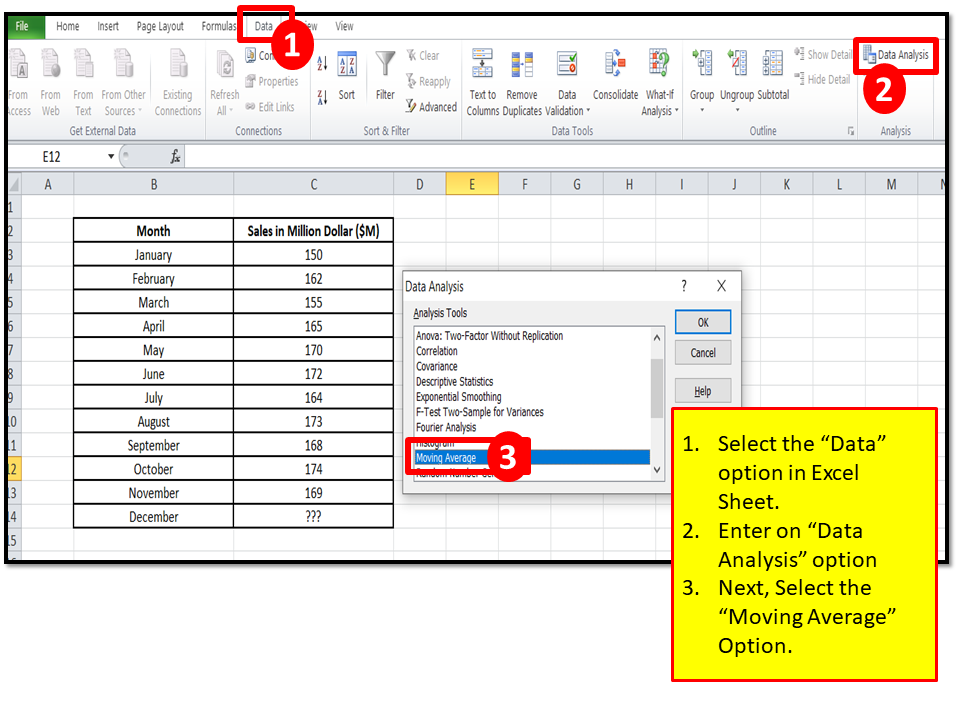
Step-2: After click on the “Data Analysis” option, a pop-up will appear on the screen. Now, you have to select the input range and enter the interval value. The details process is clearly mentioned in the below figure.
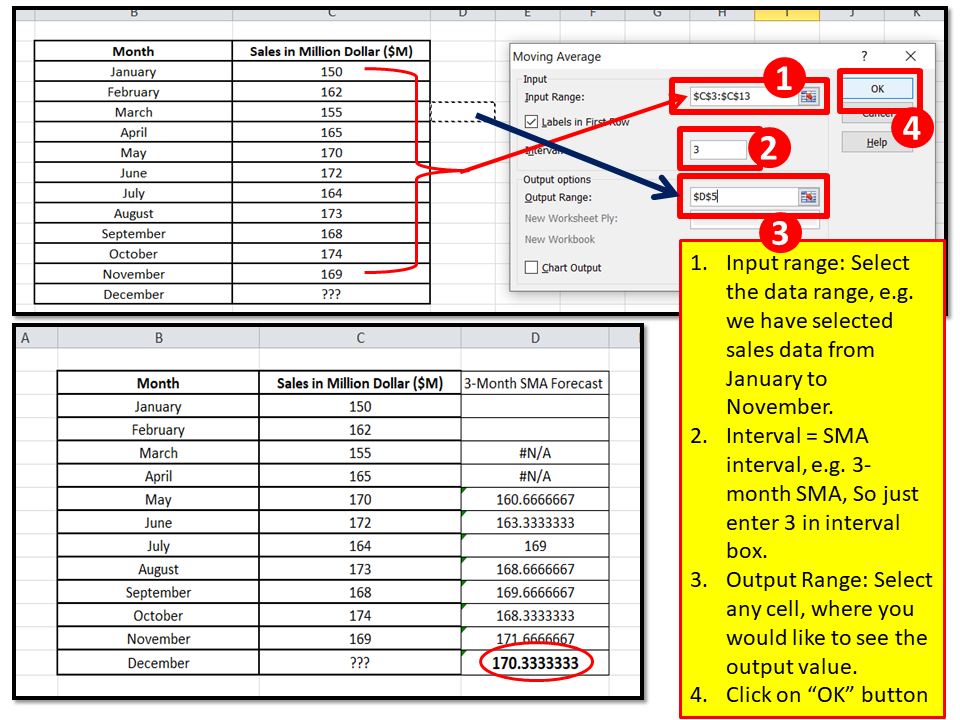
Now, as you can see the 3-month SMA forecast value of both the method is same and that is 170.33
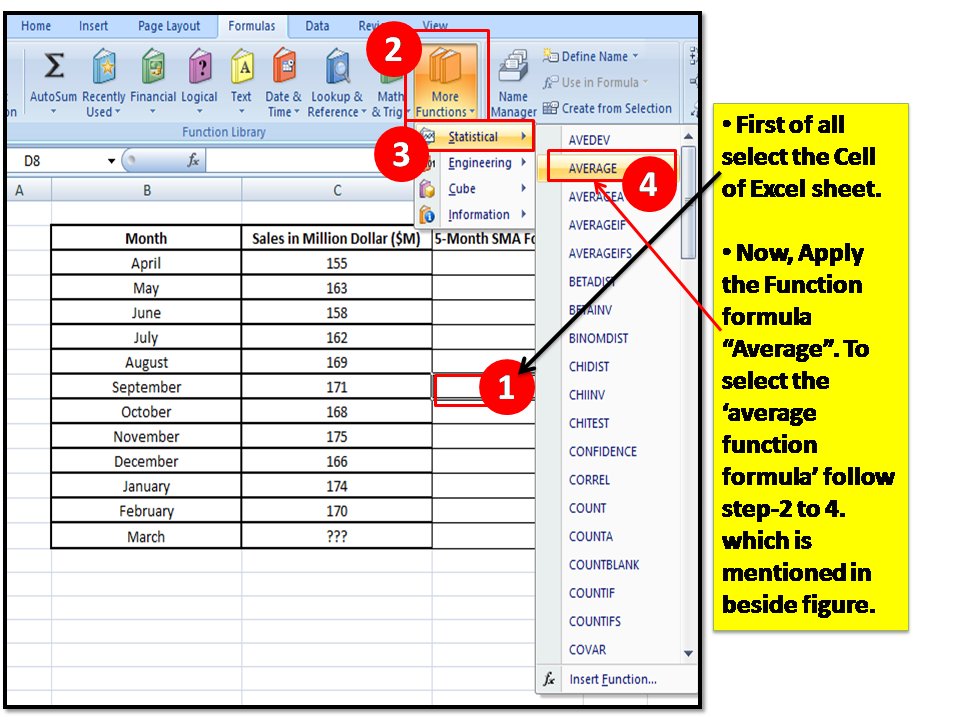
How to calculate Moving Average forecast in an excel sheet using function option?
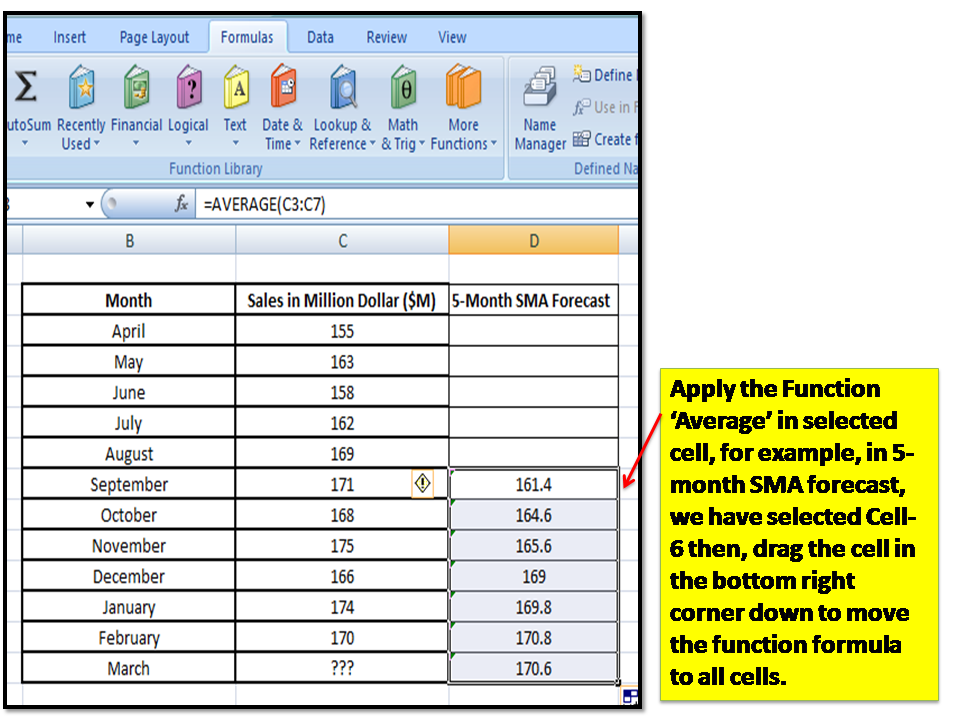
Step-1: First of all go through the data table given in below image. and based no the below data we are going to calculate the forecast value using 5-month simple moving average in excel sheet by applying function option, for doing so, you have to select the cell first, then apply the “Average’ function on that cell.
Step-2: Drag the “already applied average function cell” in the bottom right corner down to move the function formula to all cell.
Free Templates / Formats of QM: we have published some free templates or formats related to Quality Management with manufacturing / industrial practical examples for better understanding and learning. if you have not yet read these free template articles/posts then, you could visit our “Template/Format” section. Thanks for reading…keep visiting techiequality.com


Popular Post:

Shanti Gopal Pradhan is an experienced professional in Quality Management Systems, QA, Operations, Business Excellence, and Process Improvement. He has strong expertise in international standards including IATF 16949, ISO 9001, ISO 14001, ISO 45001, and ISO 17025, along with methodologies such as TQM, TPM, and Six Sigma.
He holds a degree in Mechanical Engineering along with an MBA, combining strong technical acumen with strategic business insight, he is a Certified Internal Auditor, Lead Auditor, and Six Sigma Black Belt, with a proven track record in driving quality transformation and operational excellence.