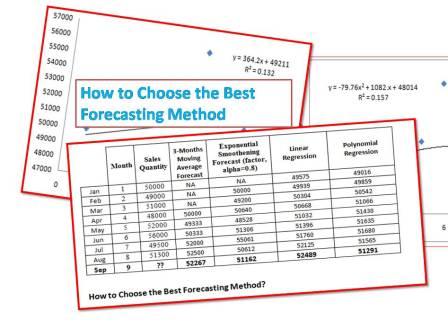
How to Choose the Best Forecasting Method | Marketing & Sales Example:
Hi Readers! Here, today we will learn on How to Choose the Best Forecasting Method with sales and marketing examples and also simultaneously study the different types of forecast methods in excel and their interpretation. As we know sales volume may not be constant in every month it depends on several factors like market demand, supply quantity, buyer interest, season, festive time, price, product features, etc. but as a market sales person how can you easily predict the future sales volume w.r.t your past sales data. If you can do it easily then similarly you can prepare the manufacturing/service plan accordingly. It could give an approximate idea for business planning. So forecasting is one of the common methodologies used in several types of industries for predicting the future based on the results of previous data.
So, especially we will talk about a sales-related example here, and different types of forecasting methods or processes or types. After reading this article I think you can be understood and select or choose or decide the best forecast methods.
Example:
Suppose a company PQR Ltd has the following below sales quantity for the last 8 months and based on the past 8 months data the sales manager is going to forecast the sales volume of 9th month but after calculating of forecast quantity of 9th month he is confused to select method which will be best. But here we will help you to choose and select the best forecast method, just go through the below concept.
| Month | Sales Quantity | |
| Jan | 1 | 50000 |
| Feb | 2 | 49000 |
| Mar | 3 | 51000 |
| Apr | 4 | 48000 |
| May | 5 | 52000 |
| Jun | 6 | 56000 |
| Jul | 7 | 49500 |
| Aug | 8 | 51300 |
| Sep | 9 | ?? |
[Table 1-Sales Quantity of past 8 months]
As you know that there are so many forecasting methods available but which one will give you the best forecast value for the 9th month, it is difficult to select at an initial time so we are going to calculate the forecast value by 3 to 4 methods and will calculate the error of each method to select the best one.
Method-1: 3-Months Moving Average Forecasting
| Month | Sales Quantity | 3-Months Moving Average Forecast | |
| Jan | 1 | 50000 | NA |
| Feb | 2 | 49000 | NA |
| Mar | 3 | 51000 | NA |
| Apr | 4 | 48000 | 50000 |
| May | 5 | 52000 | 49333 |
| Jun | 6 | 56000 | 50333 |
| Jul | 7 | 49500 | 52000 |
| Aug | 8 | 51300 | 52500 |
| Sep | 9 | ?? | 52267 |
9th Month Value= (56000+49500+51300)/3 = 52266.66
Method-2: Exponential Smoothening Forecast (let’s say, factor, alpha=0.8)
| Month | Sales Quantity | Exponential Smoothening Forecast (factor, alpha=0.8) | |
| Jan | 1 | 50000 | NA |
| Feb | 2 | 49000 | 50000 |
| Mar | 3 | 51000 | 49200 |
| Apr | 4 | 48000 | 50640 |
| May | 5 | 52000 | 48528 |
| Jun | 6 | 56000 | 51306 |
| Jul | 7 | 49500 | 55061 |
| Aug | 8 | 51300 | 50612 |
| Sep | 9 | ?? | 51162 |
9th Month Value= 0.8*51300+0.2*50612 = 41040+10122.4 = 51162.4
Method-3: Linear Regression.
| Month | Sales Quantity | |
| Jan | 1 | 50000 |
| Feb | 2 | 49000 |
| Mar | 3 | 51000 |
| Apr | 4 | 48000 |
| May | 5 | 52000 |
| Jun | 6 | 56000 |
| Jul | 7 | 49500 |
| Aug | 8 | 51300 |
| Sep | 9 | ?? |
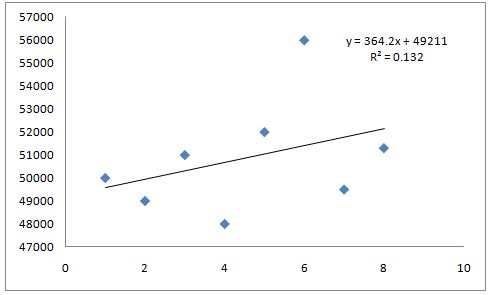
After plotting the graph, we found the Linear regressing function is 364.2*X+49211 and by using the function we have to calculate the forecast value as given below;
| Month | Sales Quantity | Linear Regression | |
| Jan | 1 | 50000 | 49575 |
| Feb | 2 | 49000 | 49939 |
| Mar | 3 | 51000 | 50304 |
| Apr | 4 | 48000 | 50668 |
| May | 5 | 52000 | 51032 |
| Jun | 6 | 56000 | 51396 |
| Jul | 7 | 49500 | 51760 |
| Aug | 8 | 51300 | 52125 |
| Sep | 9 | ?? | 52489 |
9th Month Value= 364.2*9 + 49211 =3277.8+49211 = 52488.8
Method-4: Polynomial Regression.
| Month | Sales Quantity | Polynomial Regression | |
| Jan | 1 | 50000 | 49016 |
| Feb | 2 | 49000 | 49859 |
| Mar | 3 | 51000 | 50542 |
| Apr | 4 | 48000 | 51066 |
| May | 5 | 52000 | 51430 |
| Jun | 6 | 56000 | 51635 |
| Jul | 7 | 49500 | 51680 |
| Aug | 8 | 51300 | 51565 |
| Sep | 9 | ?? | 51291 |
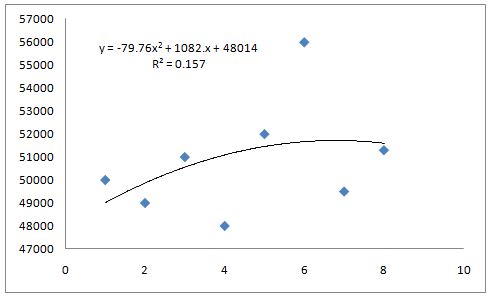
9th Month Value= -79.76*9*9 + 1082*9 +48014 =-6460.56+9738+48014 =51291.44
Methods 1 to 4 in single Table:
| Month | Sales Quantity | 3-Months Moving Average Forecast | Exponential Smoothening Forecast (factor, alpha=0.8) | Linear Regression | Polynomial Regression | |
| Jan | 1 | 50000 | NA | NA | 49575 | 49016 |
| Feb | 2 | 49000 | NA | 50000 | 49939 | 49859 |
| Mar | 3 | 51000 | NA | 49200 | 50304 | 50542 |
| Apr | 4 | 48000 | 50000 | 50640 | 50668 | 51066 |
| May | 5 | 52000 | 49333 | 48528 | 51032 | 51430 |
| Jun | 6 | 56000 | 50333 | 51306 | 51396 | 51635 |
| Jul | 7 | 49500 | 52000 | 55061 | 51760 | 51680 |
| Aug | 8 | 51300 | 52500 | 50612 | 52125 | 51565 |
| Sep | 9 | ?? | 52267 | 51162 | 52489 | 51291 |
How to Choose the Best Forecasting Method?
Now, the most important thing is to select or choose or decide the best method from the above 4 types of forecasting methods. As you can see in the above table we have mentioned the forecast value of the possible period of all 4 types of methods but even after getting the forecast value it is difficult to select the best method, so to choose the best one, we are supposed to calculate the error of each method.
| MAF-Error | ESF-Error | LR-Error | PR-Error | ||||||||
| Month | Sales Quantity | 3-Months Moving Average Forecast | Error | Square Error | Error | Square Error | Error | Square Error | Error | Square Error | |
| Jan | 1 | 50000 | NA | NA | NA | 425 | 180455 | 984 | 967783.7 | ||
| Feb | 2 | 49000 | NA | NA | -1000.00 | 1000000 | -939 | 882472.4 | -859 | 737812.3 | |
| Mar | 3 | 51000 | NA | NA | 1800.00 | 3240000 | 696 | 484973 | 458 | 209617.5 | |
| Apr | 4 | 48000 | 50000 | -2000.00 | 4000000 | -2640.00 | 6969600 | -2668 | 7117157 | -3066 | 9399375 |
| May | 5 | 52000 | 49333 | 2666.67 | 7111111 | 3472.00 | 12054784 | 968 | 937024 | 570 | 324900 |
| Jun | 6 | 56000 | 50333 | 5666.67 | 32111111 | 4694.40 | 22037391 | 4604 | 21194974 | 4365 | 19056368 |
| Jul | 7 | 49500 | 52000 | -2500.00 | 6250000 | -5561.12 | 30926056 | -2260 | 5109408 | -2180 | 4751354 |
| Aug | 8 | 51300 | 52500 | -1200.00 | 1440000 | 687.78 | 473035.8 | -825 | 679965.2 | -265 | 70415.93 |
| Sep | 9 | ?? | 52267 | MSE | 10182444 | 10957267 | 4573304 | 4439703 | |||
| RMSE | 3190.99 | 3310.18 | 2138.528 | 2107.06 |
According to the above RMSE of all four forecasting methods, we found that the Polynomial Regression method is the best method in this case. So we can consider the forecast sale quantity of 9th month is 51291.
Free Templates / Formats of QM: we have published some free templates or formats related to Quality Management with manufacturing / industrial practical examples for better understanding and learning. if you have not yet read these free template articles/posts then, you could visit our “Template/Format” section. Thanks for reading…keep visiting techiequality.com


Popular Post

Shanti Gopal Pradhan is an experienced professional in Quality Management Systems, QA, Operations, Business Excellence, and Process Improvement. He has strong expertise in international standards including IATF 16949, ISO 9001, ISO 14001, ISO 45001, and ISO 17025, along with methodologies such as TQM, TPM, and Six Sigma.
He holds a degree in Mechanical Engineering along with an MBA, combining strong technical acumen with strategic business insight, he is a Certified Internal Auditor, Lead Auditor, and Six Sigma Black Belt, with a proven track record in driving quality transformation and operational excellence.