
Variation Calculation by Excel | Types of Variation | Manufacturing Example:
Hi readers! Today we are going to calculate the different types of Variation with the help of Excel. Here we will learn the complete calculation of variation with industrial examples. All the calculations related to variation are done here with the help of the excel-2007 version, the positioning and terminology may be varied w.r.t other versions of Excel. But anyway variation calculation in excel-2007 version will give you a complete idea so you can easily apply the concept in any version of Excel as well.
This topic will help you to enhance your knowledge so that you can easily solve the problem related to variation calculation and the important things that, if you are working in the manufacturing industry and if you would like to know the data variation of process or product characteristics then by using of excel sheet easily you can calculate the variation of the data set.
Variation Calculation in Excel:
First of all, we are supposed to know that what is Variation. I mean to say that Variation is nothing but a way to show how the data is spread out, which means how the data are spread over a wide area.
Types of Variation:
There are so many ways to measures the variation but some common measures of variation used in statistics are;
- Range.
- Variance (Population, Sample).
- Standard Deviation (σ, s).
- Coefficient of Variation ((Population, Sample).
- Mean Absolute Deviation.
- Z-score
- Quartiles.
- 5-Number Summary
We will be calculating all the above measures of variation with the manufacturing example so that you can easily understand and implement the concept in your manufacturing process to know the variation of the data set.
Manufacturing Example to Calculate the Different Measures of Variation:
Let’s a company m/s PQR manufacturing the product “X”. A Quality Engineer Mr. P monitoring the process parameter as per the QA plan, but one day during the shop floor visit, the QA head observed that the process parameter of temperature reading was on the higher side, so he immediately called to process QA engineer and asked to calculate the different measurement of the variation of last period data set. Accordingly, the Process QA engineer had started the calculation, details are given below;
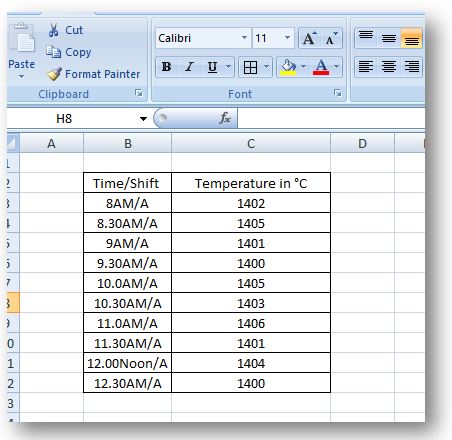
Data: Specification of Temperature: 1400±10°C
| Time/Shift | Temperature in °C |
| 8AM/A | 1402 |
| 8.30AM/A | 1405 |
| 9AM/A | 1401 |
| 9.30AM/A | 1400 |
| 10.0AM/A | 1405 |
| 10.30AM/A | 1403 |
| 11.0AM/A | 1406 |
| 11.30AM/A | 1401 |
| 12.00Noon/A | 1404 |
| 12.30AM/A | 1400 |
Here, we are going to calculate the first Range of all the above data sets.
Range = (Maximum Value – Minimum Value)
How to Calculate Range in Excel?
Step-1: Open the Excel Sheet
Step-2: Type the Data.
Step-3: Use the “MAX” function to find out the maximum value, see the below picture to learn more
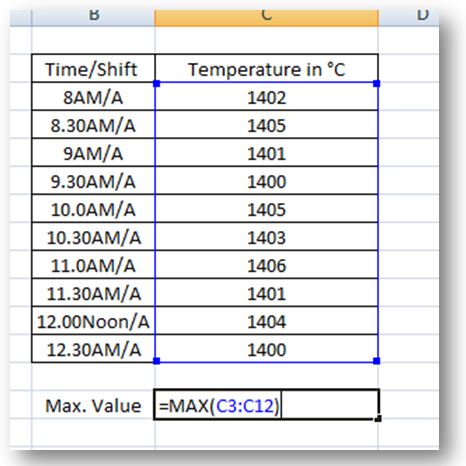
The Maximum value, we found from the above data set is 1406°C and similarly calculated the minimum value as per the below process as.
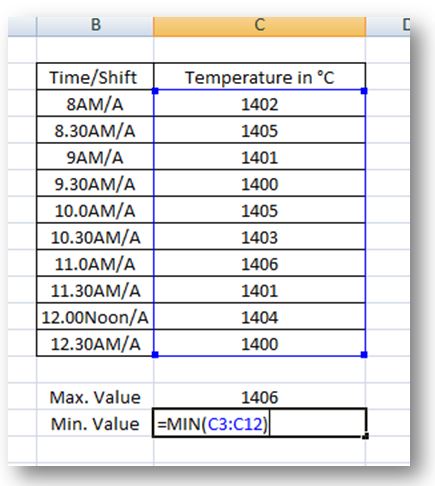
Found, the minimum value is 1400°C.
Range = (Maximum Value – Minimum Value)
=1406-1400=6°C
VARIANCE:
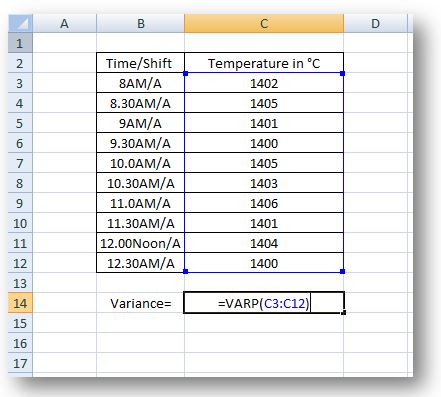
Excel-2007 function of Variance for population = VARP(data range)
The Variance of the above population data is 4.41, enter the same data in your excel sheet and calculate & check whether you are getting the same value or not.
Standard Deviation (σ):
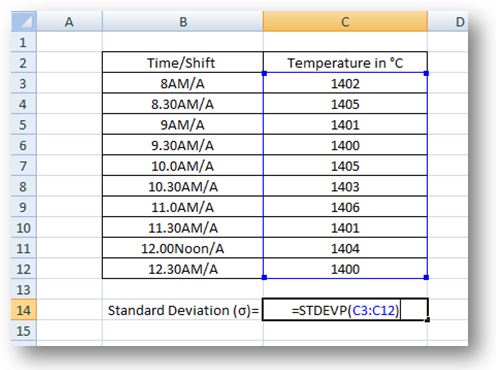
Standard Deviation (σ)excel-2007 function=STDEVP(Data range)
(σ) The standard Deviation of the above data set is 2.1, check whether you found the same value in your excel sheet or not using the above data set.
Free Templates / Formats of QM: we have published some free templates or formats related to Quality Management with manufacturing / industrial practical examples for better understanding and learning. if you have not yet read these free template articles/posts then, you could visit our “Template/Format” section. Thanks for reading…keep visiting techiequality.com


Popular Post

Shanti Gopal Pradhan is an experienced professional in Quality Management Systems, QA, Operations, Business Excellence, and Process Improvement. He has strong expertise in international standards including IATF 16949, ISO 9001, ISO 14001, ISO 45001, and ISO 17025, along with methodologies such as TQM, TPM, and Six Sigma.
He holds a degree in Mechanical Engineering along with an MBA, combining strong technical acumen with strategic business insight, he is a Certified Internal Auditor, Lead Auditor, and Six Sigma Black Belt, with a proven track record in driving quality transformation and operational excellence.