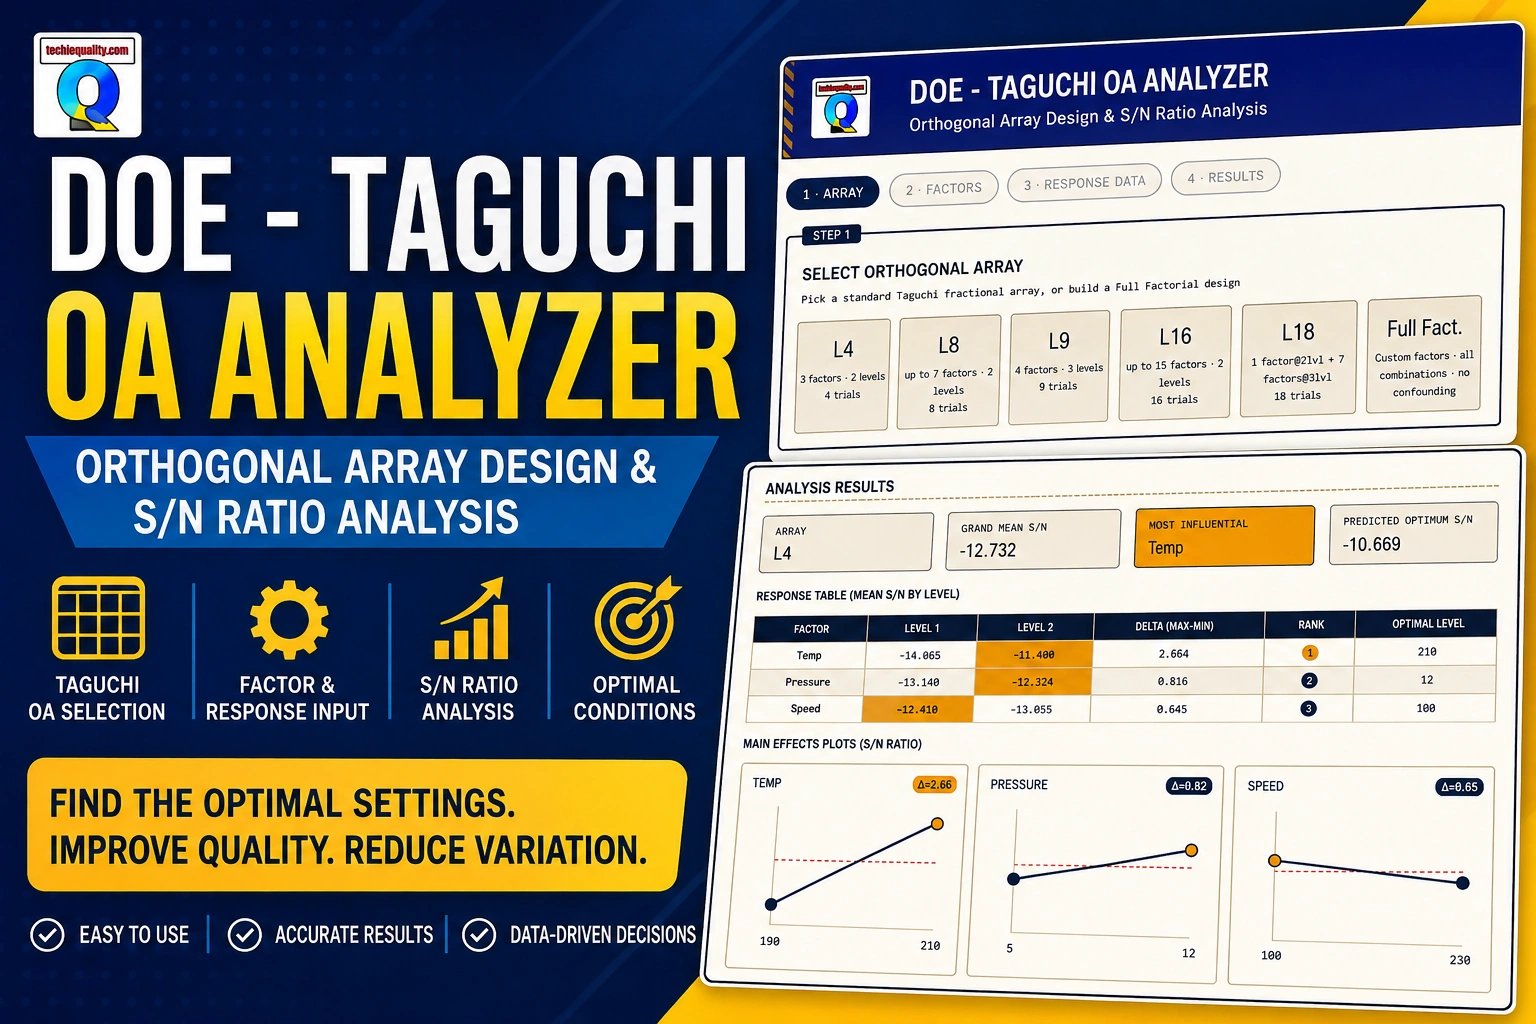
DOE Analyzer: Full Guide on How to Use
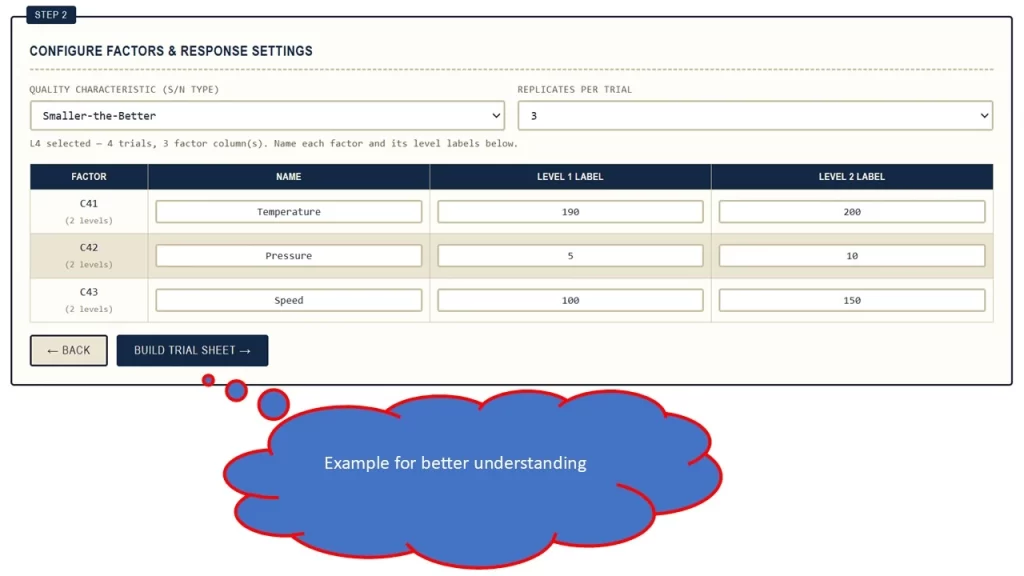
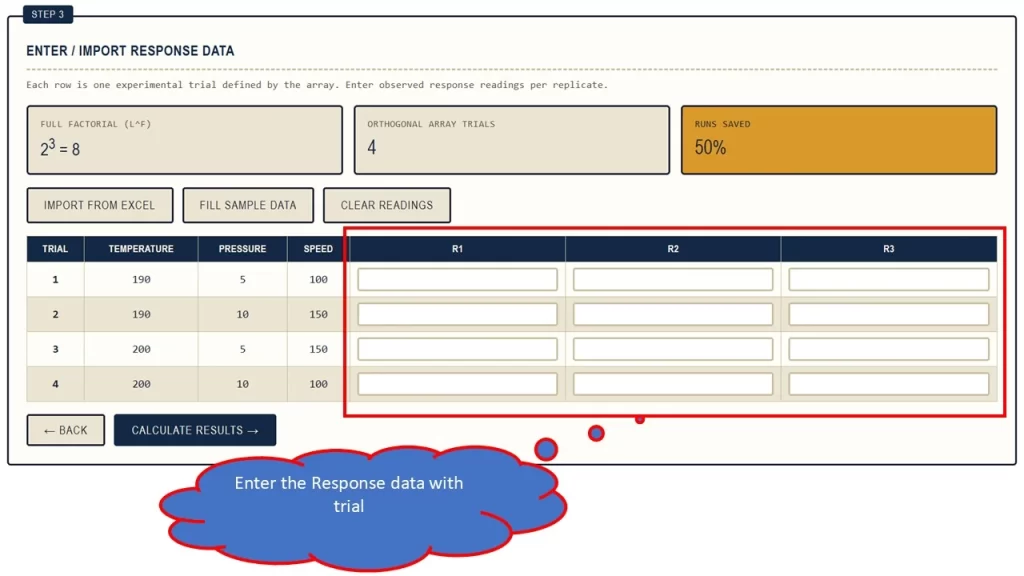
I want to conduct a Design of Experiments (DOE) study to determine the optimal process settings for minimizing shrinkage defects (%).
The proposed factors and two levels are:
| Factor | Level 1 | Level 2 |
| Temperature | 190 | 200 |
| Pressure | 5 | 10 |
| Speed | 100 | 150 |
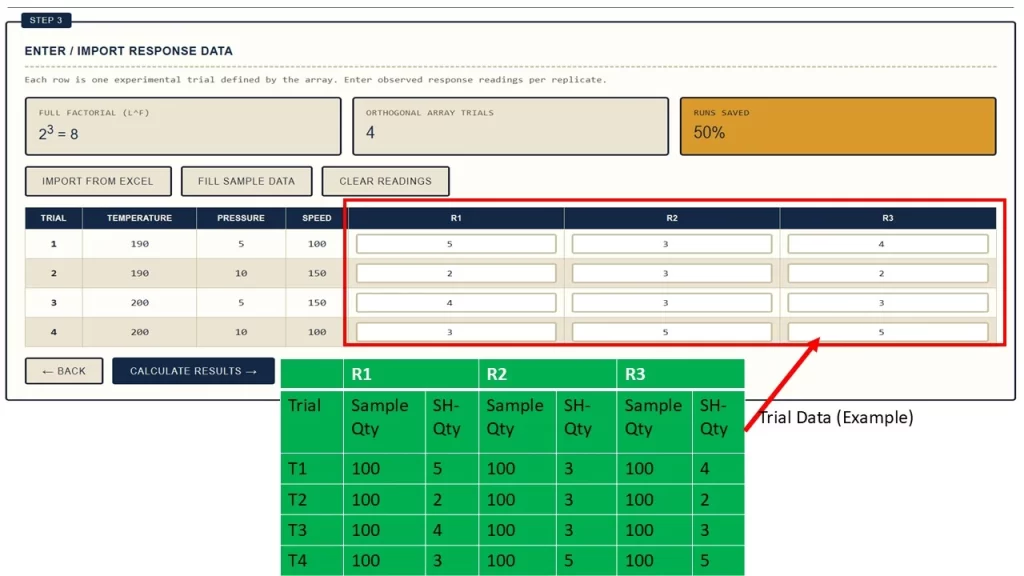
Response: Shrinkage Defects (%)
DOE Objective: Minimize shrinkage defects
S/N Characteristic: Smaller-the-Better
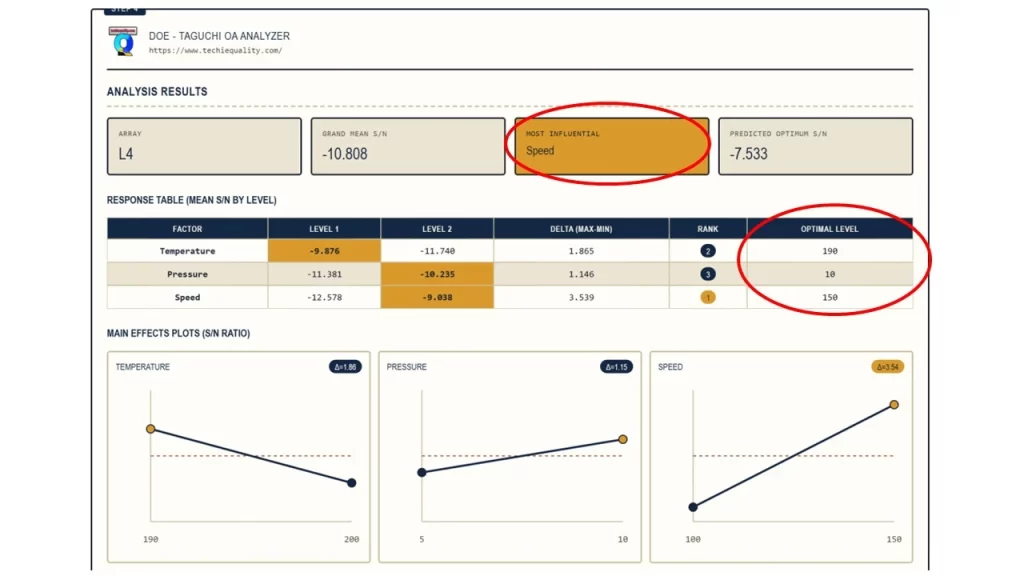
The DOE will be used to evaluate the individual effects of Temperature, Pressure, and Speed, identify the most influential factors, and determine the optimal combination of factor levels to achieve the minimum shrinkage defect percentage. A confirmation experiment should subsequently be conducted at the recommended settings to validate the DOE results.
DOE Analyzer | DOE in Six Sigma | Try Free DOE Tools
In modern manufacturing and quality engineering, improving a process by changing one parameter at a time can be slow, expensive, and sometimes misleading.
When several process factors can influence a quality characteristic, Design of Experiments (DOE) provides a structured statistical approach for studying those factors simultaneously.
DOE helps engineers answer important questions such as:
- Which process factors have the greatest influence on the response?
- Which factor level provides better performance?
- Which combination of process parameters should be selected?
- How much does each factor contribute to the observed variation?
- Can the number of experiments be reduced?
- How can a process be optimized systematically?
One of the widely used approaches for efficient experimentation is the Taguchi method, which uses Orthogonal Arrays (OA) to study multiple factors with a structured experimental design.
To make this analysis easier, an interactive Taguchi OA Analyzer / DOE Analyzer can be used to create an experimental design, enter response data, calculate Signal-to-Noise (S/N) ratios, generate response tables, rank factors, visualize main effects, and estimate factor contribution.
The DOE Analyzer is designed around this workflow. It provides Orthogonal Array selection, Full Factorial design, factor configuration, response-data entry, S/N analysis, response tables, main-effects analysis, simplified ANOVA, and result export.
What Is DOE?
DOE stands for Design of Experiments.
It is a systematic methodology for planning experiments so that the effects of multiple input factors on one or more responses can be studied efficiently.
In a manufacturing process, for example, the output may depend on:
- Temperature
- Pressure
- Speed
- Feed rate
- Cycle time
- Material
- Tool condition
- Cooling parameters
Instead of changing one parameter at a time, DOE allows several factors to be varied according to a planned experimental matrix.
Basic DOE concept
Process Factors
↓
Experimental Design
↓
Conduct Experiments
↓
Collect Response Data
↓
Statistical Analysis
↓
Identify Important Factors
↓
Select Optimum Levels
↓
Confirmation Experiment
This structured approach makes experimentation more efficient and provides a better basis for process optimization.
Why Is DOE Important in Manufacturing?
Consider a manufacturing process with four factors, each having two levels.
If every possible combination needs to be tested, the number of experiments is:
2⁴ = 16 experiments
If the number of factors increases to six:
2⁶ = 64 experiments
For larger experiments, the number of combinations can increase rapidly.
DOE methods can provide structured experimental designs that reduce the number of trials compared with testing every possible combination.
This is one reason Taguchi Orthogonal Arrays are widely associated with efficient experimentation.
What Is a Taguchi Method?
The Taguchi method is an approach to experimental design and robust process/product improvement associated with Genichi Taguchi.
A major feature of Taguchi experimentation is the use of Orthogonal Arrays.
The basic idea is to systematically vary multiple factors while using a structured experimental matrix.
Taguchi analysis also commonly uses the Signal-to-Noise (S/N) ratio to evaluate the performance and robustness of a response.
The objective is not simply to achieve a desirable average response, but to identify factor settings that provide better and more robust performance.
What is an Orthogonal Array?
An Orthogonal Array (OA) is an experimental matrix used to arrange factors and their levels in a structured manner.
Each row represents an experimental trial.
Each column can represent a factor or experimental assignment.
For example, a simple two-level experiment could look like this:
| Trial | Factor A | Factor B | Factor C |
| 1 | Low | Low | Low |
| 2 | Low | High | High |
| 3 | High | Low | High |
| 4 | High | High | Low |
The actual Orthogonal Array selected depends on the number of factors, levels, and experimental requirements.
A Taguchi OA Analyzer helps automate the creation and analysis of these experimental matrices.
What is a Taguchi OA Analyzer?
A Taguchi OA Analyzer is a tool that helps engineers create and analyse experiments based on Taguchi Orthogonal Arrays.
A typical workflow includes:
- Select an Orthogonal Array.
- Define factors.
- Define factor levels.
- Select the response characteristic.
- Enter experimental response data.
- Calculate S/N ratios.
- Generate the response table.
- Rank factors.
- Identify preferred factor levels.
- Review main effects.
- Estimate factor contribution.
- Generate/export results.
The DOE Analyzer application follows this four-stage workflow:
Array → Factors → Response Data → Results.
DOE Analyzer vs Taguchi OA Analyzer
Although the terms are sometimes used interchangeably, they can have slightly different meanings.
DOE Analyzer
A broader DOE Analyzer can support different experimental designs such as:
- Full Factorial
- Fractional Factorial
- Taguchi designs
- Other DOE approaches
Taguchi OA Analyzer
A Taguchi OA Analyzer focuses specifically on:
- Orthogonal Arrays
- Factor-level analysis
- S/N ratios
- Response tables
- Factor ranking
- Main effects
- Contribution analysis
The DOE Analyzer tool combines both concepts by supporting Taguchi Orthogonal Arrays and Full Factorial designs.
Full Factorial Design
The DOE Analyzer also provides a Full Factorial option.
In a Full Factorial experiment, all combinations of the selected factor levels are tested.
For example, with three factors and two levels:
Number of experiments = 2³ = 8
| Trial | A | B | C |
| 1 | Low | Low | Low |
| 2 | Low | Low | High |
| 3 | Low | High | Low |
| 4 | Low | High | High |
| 5 | High | Low | Low |
| 6 | High | Low | High |
| 7 | High | High | Low |
| 8 | High | High | High |
The application allows users to configure Full Factorial designs with 2 or 3 levels per factor and between 2 and 6 factors.
Factors and Levels in DOE
Understanding factors and levels is fundamental to DOE.
What Is a Factor?
A factor is an input variable that may influence the response.
For example:
- Temperature
- Pressure
- Speed
What Is a Level?
A level is the specific setting at which a factor is tested.
For example:
| Factor | Level 1 | Level 2 |
| Temperature | 150°C | 180°C |
| Pressure | 2 bar | 4 bar |
| Speed | 100 RPM | 150 RPM |
Therefore:
Factor = What you change
Level = The value at which you test it
The DOE Analyzer allows users to define factor names and level labels rather than relying only on generic factor names.
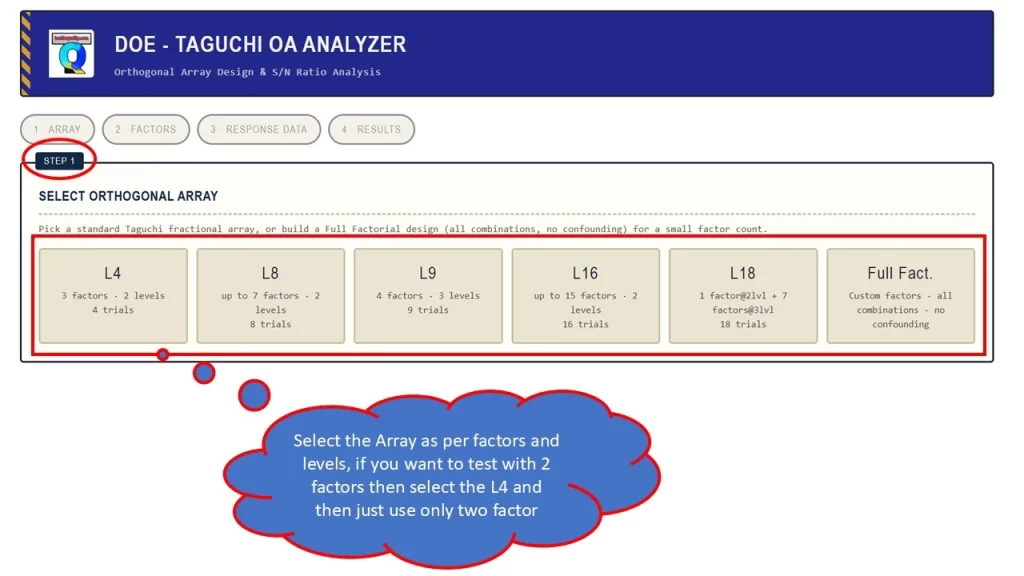
Step 1: Select the DOE Design
The first step in the analyzer is selecting the experimental design.
Depending on the experiment, the user can choose an appropriate Taguchi Orthogonal Array or build a Full Factorial design.
The design should be selected based on:
- Number of factors
- Number of levels
- Available experimental resources
- Desired interactions
- Objective of the experiment
A good experimental design is essential because the quality of the final analysis depends heavily on the quality of the experimental plan.
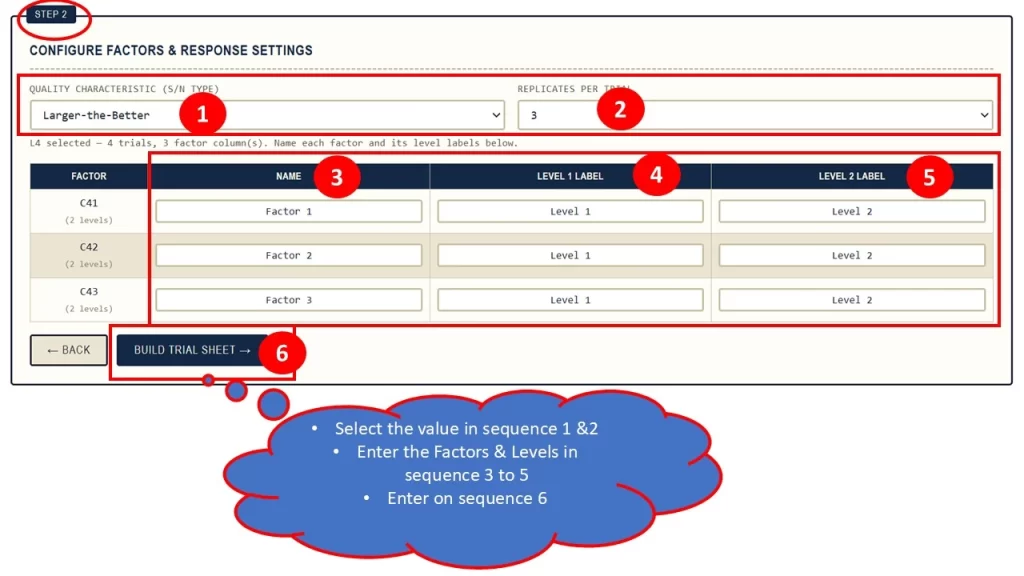
Step 2: Configure the Factors
After selecting the array, define the process factors.
Example: Injection Moulding Process
Suppose an engineer wants to study:
- Injection temperature
- Injection pressure
- Cooling time
The factors could be:
| Factor | Level 1 | Level 2 |
| Temperature | 180°C | 200°C |
| Pressure | 80 bar | 100 bar |
| Cooling Time | 10 sec | 15 sec |
These factor definitions are then mapped to the selected experimental design.
Step 3: Select the Response Characteristic
One of the most important decisions in Taguchi analysis is selecting the appropriate S/N characteristic.
The DOE Analyzer provides:
- Smaller-the-Better
- Larger-the-Better
- Nominal-the-Best
and provides a target input for Nominal-the-Best analysis.
Smaller-the-Better
Use Smaller-the-Better when lower values are desirable.
Examples include:
- Defects
- Rejection
- Scrap
- Leakage
- Noise
- Cycle time
- Dimensional variation
Example
If the objective is:
Minimize defects
then:
S/N characteristic = Smaller-the-Better
Larger-the-Better
Use Larger-the-Better when higher values are desirable.
Examples:
- Strength
- Efficiency
- Battery life
- Productivity
- Output
- Reliability
Example
If the objective is:
Maximize battery life
then:
S/N characteristic = Larger-the-Better
Nominal-the-Best
Use Nominal-the-Best when the target value is important.
Examples include:
- Diameter
- Thickness
- Voltage
- Pressure
- Weight
- Dimension
For example:
Target = 25.00 mm
The objective is to keep the measured value as close as possible to 25.00 mm.
The analyser supports a target value for this characteristic.
Step 4: Enter Response Data
Once the experiment has been performed, the measured responses must be entered.
For example:
| Trial | Replicate 1 | Replicate 2 | Replicate 3 |
| 1 | 12.1 | 12.3 | 12.2 |
| 2 | 13.4 | 13.5 | 13.3 |
| 3 | 11.8 | 11.9 | 11.7 |
| 4 | 14.1 | 14.0 | 14.2 |
The application supports multiple replicate readings per trial.
It also provides the ability to import experimental data from Excel.
What is the S/N Ratio?
The Signal-to-Noise ratio is an important component of Taguchi analysis.
The S/N ratio provides a way to evaluate the relationship between desirable performance and variation.
The objective is generally to identify factor levels that produce a higher S/N ratio for the selected quality characteristic.
The DOE Analyzer calculates an S/N value for each experimental trial and uses those values to generate factor-level response information.
Response Table in Taguchi Analysis
The response table is one of the most useful outputs from a Taguchi OA Analyzer.
For each factor, the average S/N ratio is calculated at each level.
For example:
| Factor | Level 1 S/N | Level 2 S/N | Delta | Rank |
| Temperature | 18.2 | 22.5 | 4.3 | 1 |
| Pressure | 20.1 | 21.0 | 0.9 | 3 |
| Speed | 22.0 | 19.4 | 2.6 | 2 |
The analyser calculates the Delta as:
Delta = Maximum Level Average − Minimum Level Average
Factors are then ranked according to their delta values.
How to Interpret Factor Ranking
Suppose the response table gives:
| Factor | Delta | Rank |
| Temperature | 4.3 | 1 |
| Speed | 2.6 | 2 |
| Pressure | 0.9 | 3 |
Temperature has the highest delta.
This indicates that the average S/N response changes more across its levels than the other factors in this analysis.
Therefore, temperature is ranked as the most influential factor according to this response table measure.
Important: Factor ranking based on delta should be interpreted as a measure of relative effect in the selected DOE analysis, not automatically as proof of statistical significance.
How to Find the Optimum Factor Levels
The best level for each factor is generally the level having the highest average S/N ratio for the selected Taguchi characteristic.
For example:
| Factor | Level 1 | Level 2 | Selected Level |
| Temperature | 18.2 | 22.5 | Level 2 |
| Pressure | 20.1 | 21.0 | Level 2 |
| Speed | 22.0 | 19.4 | Level 1 |
The recommended combination becomes:
Temperature = Level 2
Pressure = Level 2
Speed = Level 1
This combination should then be validated using a confirmation experiment.
Simplified ANOVA and Factor Contribution
ANOVA stands for Analysis of Variance.
It can be used to estimate how variation in the response is associated with different factors.
The analyser provides a simplified ANOVA contribution section containing:
- Sum of Squares
- Degrees of Freedom
- Mean Square
- Contribution %
The application’s calculation determines the contribution relative to total variation in the S/N response.
Example:
| Factor | Contribution |
| Temperature | 48.2% |
| Pressure | 24.3% |
| Speed | 16.5% |
| Error | 11.0% |
In this example, temperature accounts for the largest calculated contribution.
Again, this should be interpreted within the specific analysis method and experimental design rather than treated as a complete hypothesis-testing ANOVA.
Predicted Optimum
After identifying the best factor levels, the analyser calculates a predicted optimum S/N ratio.
The application uses the grand mean and the selected best-level S/N values to calculate the prediction.
The predicted value provides an estimate of the expected performance at the selected combination.
However, prediction should always be followed by a confirmation experiment.
DOE Analyzer Features
The DOE Analyser provides the following capabilities:
Experimental Design
- Taguchi Orthogonal Arrays
- Full Factorial design
- 2-level experiments
- 3-level experiments
- Custom factor configuration
Factor Configuration
- Custom factor names
- Custom level labels
- Multiple factor levels
Response Analysis
- Larger-the-Better
- Smaller-the-Better
- Nominal-the-Best
- Target value for Nominal-the-Best
- Multiple replicate readings
Statistical Results
- Trial S/N values
- Grand mean
- Response table
- Delta
- Factor ranking
- Best factor levels
- Main-effects plots
- Simplified ANOVA
- Factor contribution
- Predicted optimum
Data and Reporting
- Sample data
- Excel import
- Excel result export
- PDF report generation
These capabilities are reflected directly in the application’s interface and analysis logic.
Who Should Use a DOE Analyzer?
Quality Engineers
Useful for:
- Defect reduction
- Process optimization
- Variation reduction
- Quality improvement
- Root-cause investigation
Manufacturing Engineers
Useful for:
- Machine parameter optimization
- Cycle-time improvement
- Process parameter selection
- Productivity improvement
Six Sigma Professionals
DOE is particularly useful during the Improve phase of DMAIC.
R&D Engineers
DOE can help evaluate:
- Product parameters
- Material combinations
- Design conditions
- Process settings
Students and Beginners
A visual analyser can help users understand:
- Factors
- Levels
- Orthogonal Arrays
- S/N ratios
- Response tables
- Main effects
- Factor ranking
DOE in Six Sigma
DOE is an important statistical tool in Six Sigma.
A typical improvement project may follow:
Define → Measure → Analyse → Improve → Control
DOE is particularly useful during the Improve stage when the team has identified potential process factors and wants to determine which factor settings produce better performance.
For example:
Problem: High rejection
↓
Potential factors: Temperature, pressure, speed
↓
DOE: Planned experiment
↓
Response: Defect count
↓
S/N Analysis
↓
Factor Ranking
↓
Optimum Levels
↓
Confirmation Run
↓
Standardize Process
This approach provides a structured path from experimentation to process optimization.
Advantages of Using a DOE Analyzer
A DOE Analyzer can provide several practical advantages.
Faster Analysis
Automated calculations reduce repetitive spreadsheet work.
Structured Workflow
The user follows a defined sequence from design selection to results.
Reduced Calculation Errors
Automating repetitive calculations can reduce manual formula errors.
Easy Factor Comparison
Response tables and rankings make factor comparison easier.
Visual Analysis
Main-effects plots provide an intuitive view of factor-level behaviour.
Data Import
Existing Excel experimental data can be brought into the application.
Reporting
Results can be exported for documentation and communication.
Common DOE Mistakes
Mistake 1: Choosing Too Many Factors Without a Clear Objective
Start with factors that have a reasonable technical basis.
Mistake 2: Selecting Incorrect Levels
Factor levels should be meaningful and practically achievable.
Mistake 3: Using the Wrong S/N Characteristic
For example, defect count should generally be treated as a smaller-is-better objective, while strength may be larger-is-better.
Mistake 4: Ignoring Measurement Variation
Poor measurement capability can distort DOE results.
Mistake 5: Treating Factor Ranking as Proof of Significance
A higher delta indicates a larger observed change across factor levels in the response-table analysis, but it should not automatically be interpreted as statistical significance.
Mistake 6: Skipping Confirmation Experiments
The predicted optimum should be verified experimentally before being implemented in production.
Frequently Asked Questions
What does DOE stand for?
DOE stands for Design of Experiments.
What is a DOE Analyzer?
A DOE Analyzer is a tool used to design and analyse experiments involving multiple factors and responses.
What is a Taguchi OA Analyzer?
A Taguchi OA Analyzer is a tool designed to work with Taguchi Orthogonal Arrays and analyse experimental responses using methods such as S/N ratio analysis and response tables.
What is an Orthogonal Array?
An Orthogonal Array is a structured experimental matrix used to arrange factor-level combinations for an experiment.
What is the S/N ratio?
The Signal-to-Noise ratio is a Taguchi analysis measure used to evaluate response performance relative to variation according to the selected quality characteristic.
What are the three Taguchi S/N characteristics?
The commonly used characteristics are:
- Smaller-the-Better
- Larger-the-Better
- Nominal-the-Best
The Techiequality supports all three.
Can I perform Full Factorial DOE?
Yes. The Techiequality DOE analyser includes a Full Factorial design option.
Can I import Excel data?
Yes. The application provides Excel import functionality for response data.
Can I export the DOE results?
Yes. The application provides Excel and PDF export functionality.
Can a DOE Analyzer determine the optimum process setting?
It can identify the best tested factor level based on the selected S/N response and calculate a predicted optimum S/N value. The resulting settings should then be confirmed experimentally.
Thanks for visiting Techiequality

Shanti Gopal Pradhan is an experienced professional in Quality Management Systems, QA, Operations, Business Excellence, and Process Improvement. He has strong expertise in international standards including IATF 16949, ISO 9001, ISO 14001, ISO 45001, and ISO 17025, along with methodologies such as TQM, TPM, and Six Sigma.
He holds a degree in Mechanical Engineering along with an MBA, combining strong technical acumen with strategic business insight, he is a Certified Internal Auditor, Lead Auditor, and Six Sigma Black Belt, with a proven track record in driving quality transformation and operational excellence.