Skip to content

TECHIEQUALITY

Menu
  • HOME
  • QUALITY (QA, QMS, 6-Sigma, TQM, TPM)
  • TEMPLATE & FORMAT
  • SAFETY
  • MISCELLANOUS
  • E-SHOP

Pareto Chart Excel Template | Download format

By TECHIEQUALITY 26/01/2024 QUALITY, Template & Format 0 Comments
Pareto Chart Excel Template
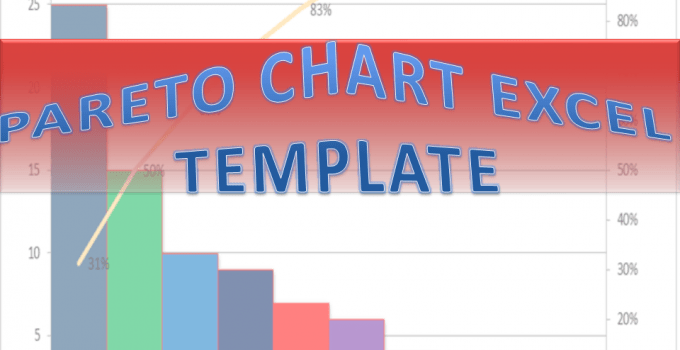
Pareto Chart Excel Template | Step by Step guide of template usages:- Hi Readers! In this article, we have discussed on Pareto Chart Excel Template with a manufacturing example. and also you can learn here, the Pareto chart principle (80/20 rule)....
[Continue reading...]

Fishbone Diagram Template With Example

By TECHIEQUALITY 26/01/2024 QUALITY, Template & Format 0 Comments
Fishbone Diagram Template
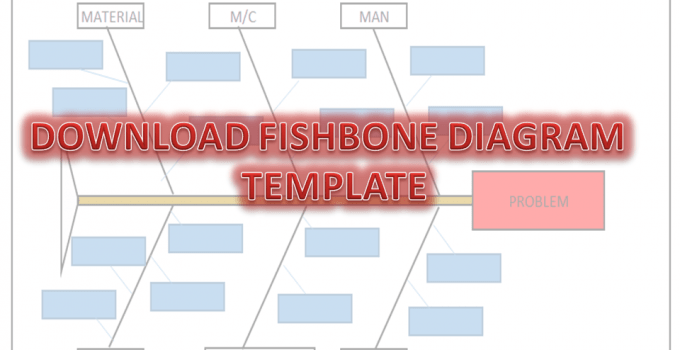
Fishbone Diagram Template With Example | Download Template Download the Fishbone Diagram Template by clicking on the below link. Fishbone Diagram will help you to represent the Potential Causes of a Problem. DOWNLOAD the Cause & Effect Diagram / Fishbone Diagram....
[Continue reading...]

How to calculate z-score in excel with manufacturing example

By TECHIEQUALITY 25/01/2024 QUALITY, Template & Format 0 Comments
How to calculate z-score in excel
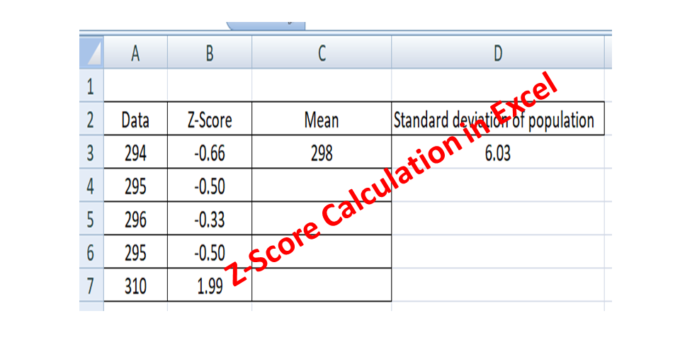
How to calculate z-score in excel with a manufacturing example: Hi Readers! Here, we are going to learn today how to calculate z-score in excel with manufacturing examples. And also we will understand the standard deviation calculation based on the sample...
[Continue reading...]

7QC Tools for Problem Solving | What are 7 QC Tools

By TECHIEQUALITY 25/01/2024 QUALITY 0 Comments
7QC Tools for Problem Solving
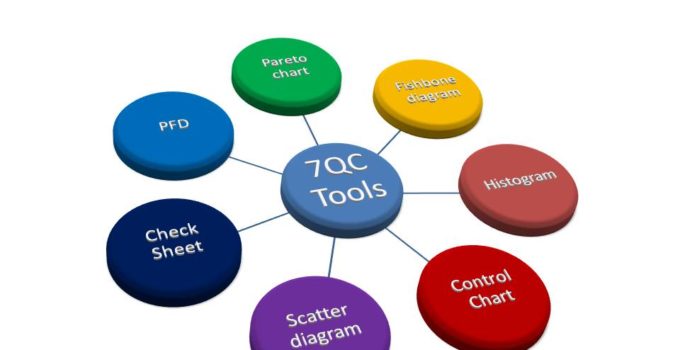
7QC Tools for Problem Solving | What are 7 QC Tools 7QC Tools for Problem Solving techniques are generally used in manufacturing, Non-manufacturing industries, and service sectors to resolve problems. Download 7-QC Tools Template/ Format Definition and History:- The 7QC Tools...
[Continue reading...]

What is SPC | SPC Tools

By TECHIEQUALITY 25/01/2024 QUALITY 0 Comments
What is SPC
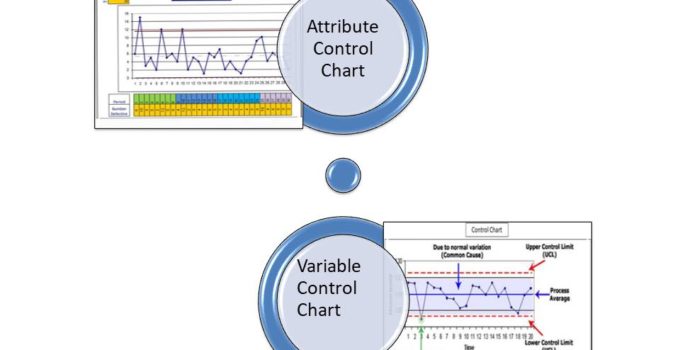
What is SPC | SPC Tools What is SPC ? SPC is the Statistical Process Control. History and Definition:- Statistical Process Control is a technique of quality control that services statistical methods to monitor and control processes. This ensures the process...
[Continue reading...]

Corrective and Preventive Action Format | CAPA with Example

By TECHIEQUALITY 25/01/2024 QUALITY, Template & Format 0 Comments
Corrective and Preventive Action Format, capa format, capa format in word, capa format in excel
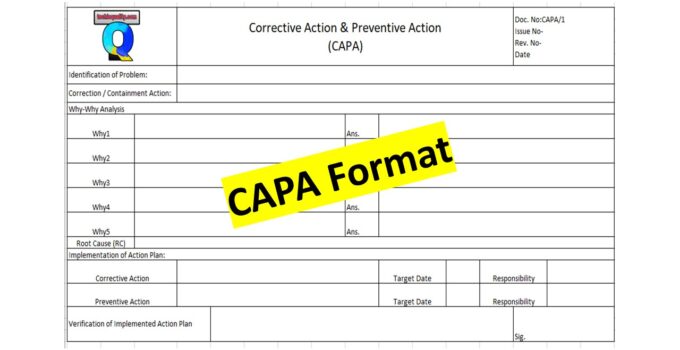
Corrective and Preventive Action Format | Download CAPA Format: Corrective and Preventive Action Format with an example is illustrated below. CAPA has generally eliminated the causes of nonconformity. It is usually a set of actions i.e corrective action and preventive action,...
[Continue reading...]

OEE Calculation-How To Calculate OEE (Overall Equipment Effectiveness) with Example

By TECHIEQUALITY 25/01/2024 QUALITY 0 Comments
OEE Calculation
OEE Calculation-How To Calculate OEE (Overall Equipment Effectiveness) with Example:- OEE Calculation is a simple calculation which is multiplied by availability, Performance and Quality. It is a methodology to measure the productivity of Process industries. If your manufacturing process OEE indicates...
[Continue reading...]

Implementation of KAIZEN in Industry

By TECHIEQUALITY 25/01/2024 QUALITY, Template & Format 0 Comments
Implementation of KAIZEN in Industry
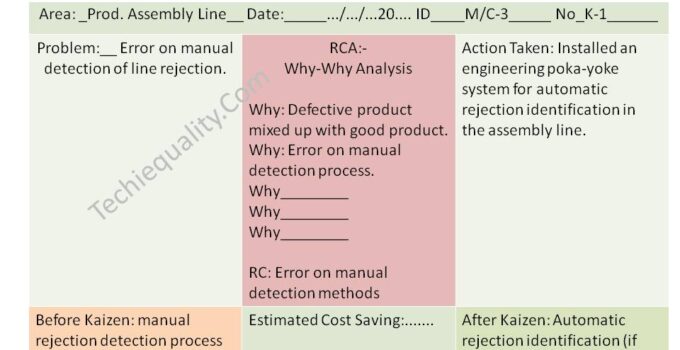
Implementation of KAIZEN in Industry: Implementation of KAIZEN in Industry is the most important key to the Industry for Continuous Improvement in any type of Loss or Waste. But the sustaining of any type of kaizen is the question mark for...
[Continue reading...]

CAPA Process with Example

By TECHIEQUALITY 25/01/2024 QUALITY 0 Comments
CAPA Process
CAPA Process | Examples Hi readers, here we are going to discuss the details of the CAPA Process and the ISO standard requirement of concept capa and also describe here with definition and comparison with the new ISO 9001:2015 and IATF...
[Continue reading...]

How to plot Histogram in Excel with Manufacturing example

By TECHIEQUALITY 25/01/2024 QUALITY 0 Comments
How to plot Histogram in Excel
How to plot Histogram in Excel with Manufacturing Example How to plot Histogram in Excel, Step-by-step guidance is described below A histogram is one of the 7QC tools and commonly used graphs to show frequency distribution. Helps summarize data from a...
[Continue reading...]

Posts pagination

1 … 9 10 11 12 13 … 20

QA, QC, 6-Sigma-Template & Format

  • Six-Sigma Project Charter template
  • DMAIC Tools
  • SIPOC Template
  • C-Chart Excel Template
  • DPMO & DPPM excel Calculator
  • PFD Excel Format
  • Z-Score Excel Calculator Template
  • KAIZEN Report Template
  • MTTR & MTBF Template
  • Scatter Diagram Template
  • Dispersion Analysis C&E Template
  • 3MU (MUDA) Check Sheet
  • 4M Checklist
  • FTA Template
  • Pp & Ppk Template
  • Cp & Cpk Template
  • CAPA Format.
  • Pareto Chart Template.
  • Fishbone Diagram Template.
  • Histogram Template
  • 8D template.
  • Control Chart Template.
  • Run Chart Excel Template.
  • Risk Identification Template.
  • OEE Calculation Format
  • SWOT Analysis Template
  • 5W1H Template
  • 5W2H Template
  • P Chart Template
  • 5 Whys Excel Template


Join Us:

Telegram
LinkedIn
Pinterest
Twitter
  • QC Template, Advanced Tools and Techniques
  • Internal Audit | Types | Types of Auditors | Manufacturing Example
  • How to Create a Drop Down List in Excel Template with Manufacturing Example
  • SDCA Cycle understanding with Manufacturing Example | PDCA vs SDCA
  • Normal Distribution Probability Formula, Calculation & Manufacturing Examples

SITE LINKS

  • About Us:
  • Contact Us
  • Disclaimer
  • Download Quality Template & Format
  • DOWNLOADABLE DIGITAL PRODUCTS
  • QUALITY MANAGEMENT
  • SAFETY MANAGEMENT
  • Terms & Privacy Policy

CATEGORIES

  • Miscellanous
  • QUALITY
  • SAFETY MANAGEMENT
  • Template & Format

Join Us

TEMPLATES

Quality-Template

Share on…

TECHIEQUALITY Copyright © 2025.
Theme by TECHIEQUALITY. Back to Top ↑