How to do data analysis by excel sheet? i| Step by step guides
Hi Readers! Today we will discuss an important topic i.e. How to do data analysis by excel sheet. Data analysis is very important and it helps to make the correct decision on fact basis. While data analysis we generally use many tools/ techniques like 7QC Tools (Pareto chart, fishbone diagram, histogram, scatter diagram, control chart, checklist, diagram & PFC) and Statistical tools, etc. Basically, we use several platforms to execute the test or plot the graph to know the interpretation of results. But with the help of a simple Excel sheet you can analyze your data by doing advanced tests like Regression analysis, Correlation, ANOVA, Z-test, etc. but you can’t get the option of those tests directly in your Excel sheet, for getting the option you have to install the data analysis tools in your excel sheet, so we will aid you through this article for easy installation of analysis tools.
DOWNLOAD:-Several Data Analysis Tools
Below are the step-by-step installation processes of Data Analysis Tools:
Step-1:
We cannot find the Data Analysis option in excel sheet because this tool is not pre-installed. You have to install it manually, so open your excel sheet and then click on the Office Button, and then follow the step-2 mentioned in the below figure.
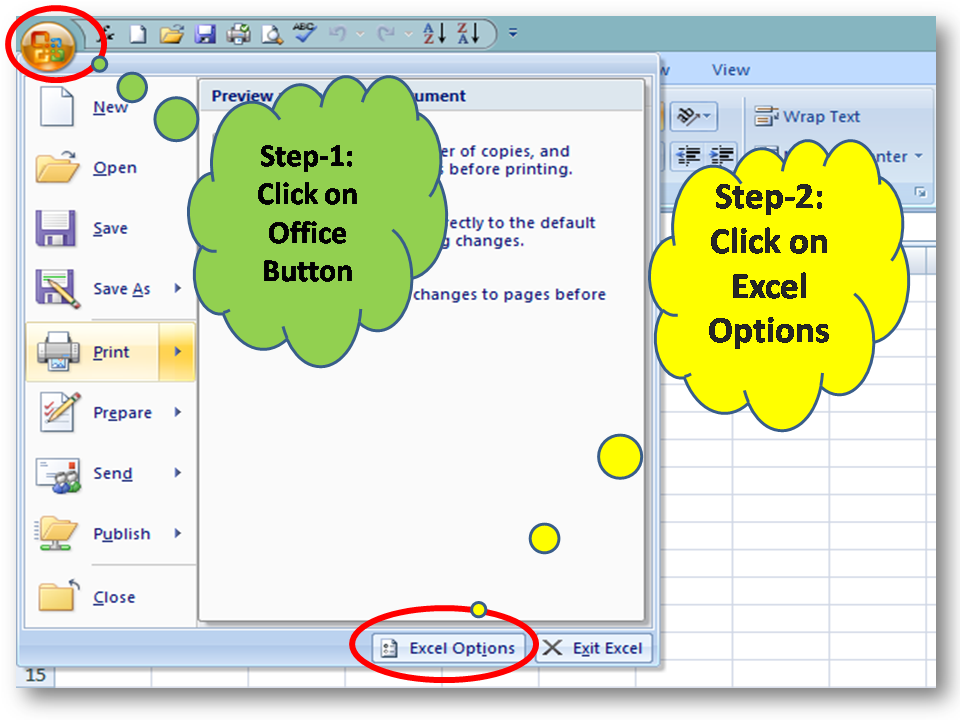
Step-2:
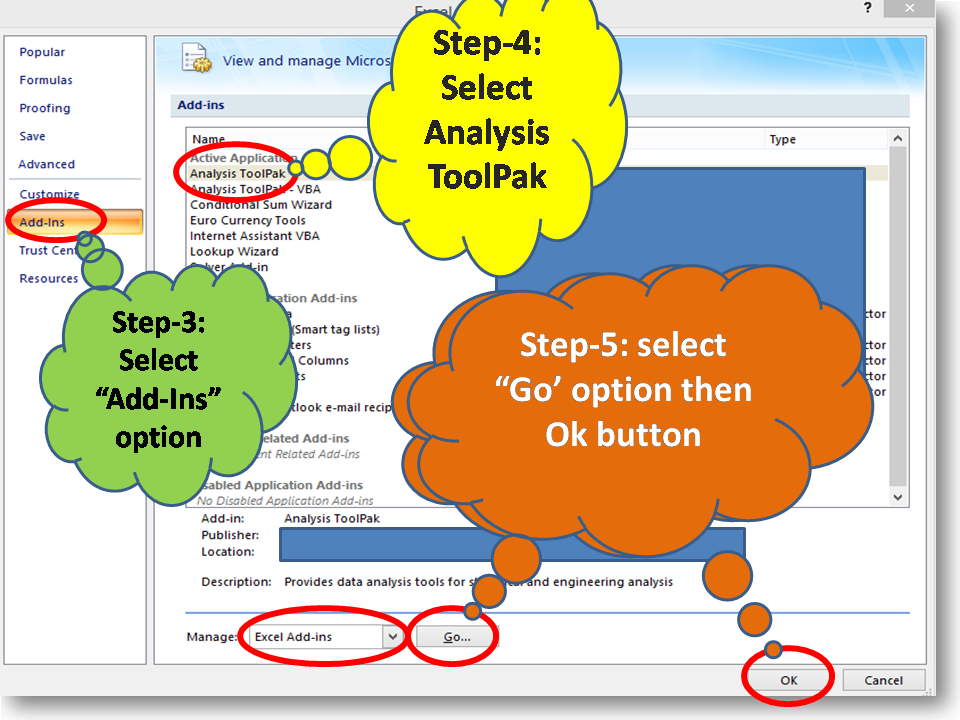
Now select the Add-Ins” option as shown in the below figure, next select Analysis ToolPak, and then follow the step-5 of below figure to install the Analysis Tool Pack.
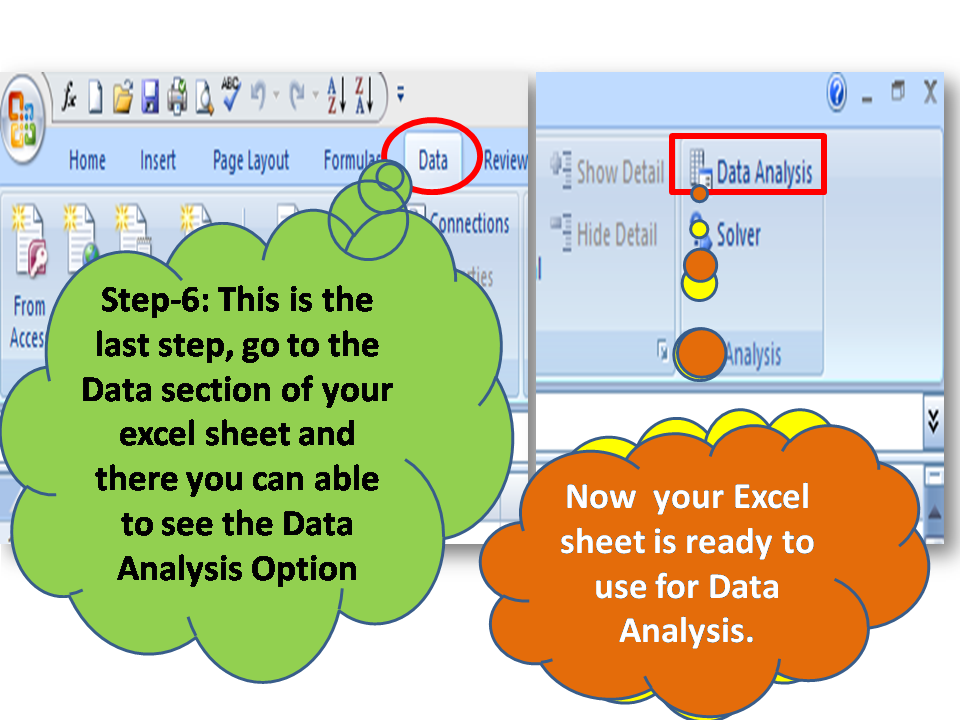
Step-3:
You have successfully installed the Data Analysis Tools Pack, and now you are ready to use the Data Analysis options. Just go to the Data section in excel sheet for usages of Analysis Tools.
For doing individual tests like correlation, regression analysis, ANOVA, Z-test, etc, open the data analysis option and select the data as per individual test instructions.
FAQ:
How to organize data in excel for analysis?
Ans.: it depends on which data analysis tools you are going to use, for example, if are going to do the ANOVA-single factor test then the selection criteria and data arrangement will be different than other tests like paired comparison, 2P test, etc.
What are the common data analysis tools used in manufacturing industries?
There are many common tools used in the manufacturing industry but some are 7QC tools, why-why analysis, 5 Core tools, hypothesis testing tools, etc. Directly you can also use the data analysis tool in excel which is given in the “Data” section in excel as Data Analysis. just you have to install the same by following the above process. so follow the above steps and use it for data analysis. you can also use the excel function for data analysis, it purely depends on the data type, nature of the test, etc.
Free Templates / Formats of QM: we have published some free templates or formats related to Quality Management with manufacturing / industrial practical examples for better understanding and learning. if you have not yet read these free template articles/posts then, you could visit our “Template/Format” section. Thanks for reading…keep visiting techiequality.com
Popular Post:

Shanti Gopal Pradhan is an experienced professional in Quality Management Systems, QA, Operations, Business Excellence, and Process Improvement. He has strong expertise in international standards including IATF 16949, ISO 9001, ISO 14001, ISO 45001, and ISO 17025, along with methodologies such as TQM, TPM, and Six Sigma.
He holds a degree in Mechanical Engineering along with an MBA, combining strong technical acumen with strategic business insight, he is a Certified Internal Auditor, Lead Auditor, and Six Sigma Black Belt, with a proven track record in driving quality transformation and operational excellence.